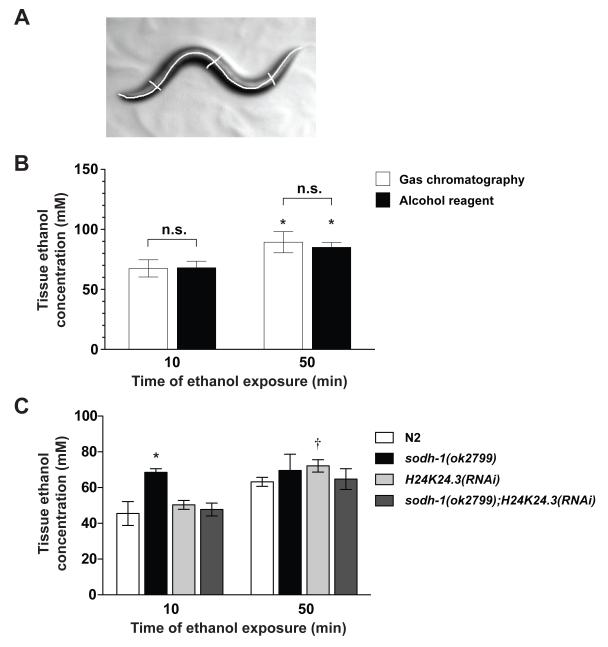
Figure 2. Determination of internal ethanol concentration in wild-type and ADH compromised animals.
(a) An example of worm volume measurements. The volume of a worm was determined by taking photographs of animals immediately before they were used for the biochemical analysis. Each animal was traced (n=10 for each strain) to determine the length, h. The diameter of the animal, d, was the average of three widths, one at the vulva, and one each at the midpoint between the vulva and head or tail. The volume was calculated using formula for the volume of a cylinder (volume = πr2h). (b) There is no difference in internal ethanol concentration measurements using gas chromatograph (GC) and spectrophotometric analysis at 500 mM when actual worm volume was used in the calculation. A significant difference is observed between time points (GC: 10 minutes vs. 50 minutes P < 0.05; Spectrophotometric analysis: 10 minutes vs. 50 minutes P < 0.05). (c) Internal ethanol measurements of 200 worms, treated with 400 mM exogenous ethanol, calculated from spectrophotometric analysis. sodh-1(ok2799) was different from N2 at 10 minutes but not at 50 minutes. H24K24.3(RNAi) was not different from N2 at either timepoint. sodh-1(ok2799);H24K24.3(RNAi) was not different from N2 at either timepoint. * Significantly different from N2 at the same timepoint (P < 0.05) † Significantly different from the same strain across timepoints (P < 0.05).

