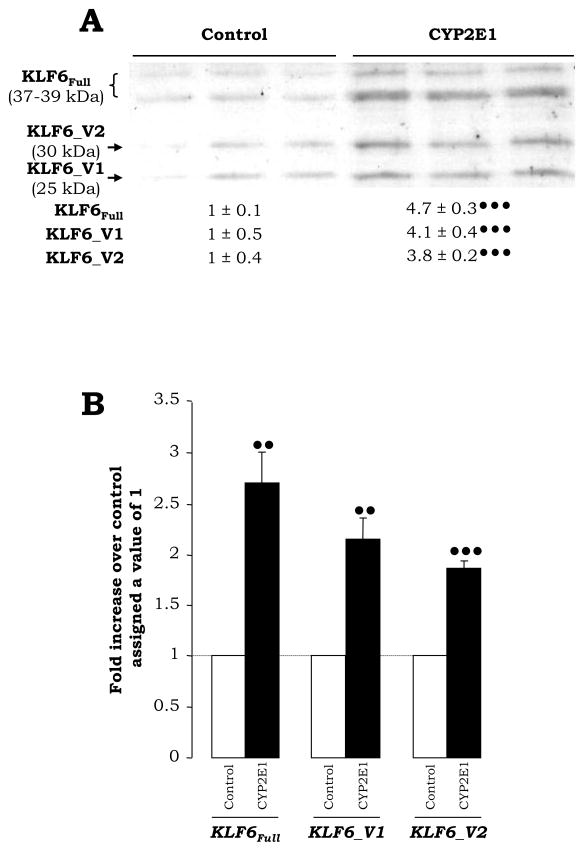
Fig. 2. Expression of KLF6Full and its Splice Variants in CYP2E1-Expressing Cells.
The expression of KLF6Full, KLF6_V1 and KLF6_V2 protein was analyzed by Western blot. The quantification of the signal was referred to the average signal in the controls, which was assigned a value of 1 (A). qRT-PCR for KLF6Full, KLF6_V1 and KLF6_V2 in control and CYP2E1-expressing cells (B). In both panels, results are expressed as fold increase over the control which was assigned a value of 1 (dashed line in (B)) and refer to means ± SEM (N=3, ••P<0.01 and •••P<0.001 for CYP2E1-expressing cells vs. control).

