
Figure 2.
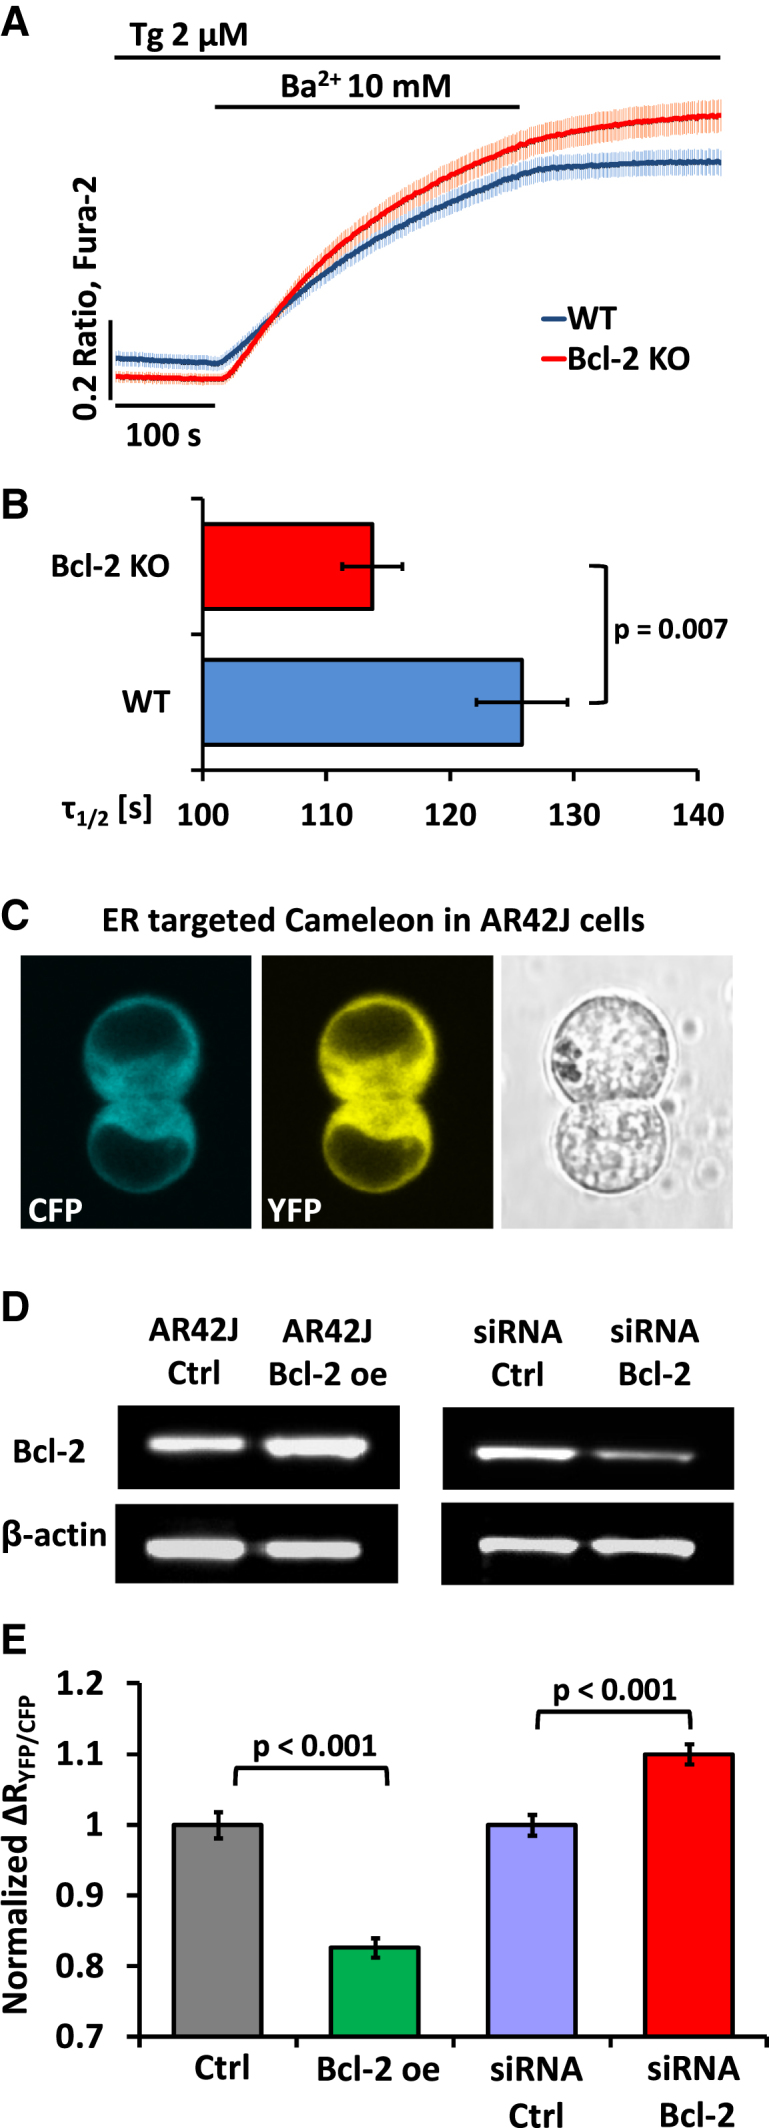
Effects of Bcl-2 on Ca2+/Ba2+ Influx and [Ca2+]ER
(A) Changes in the average [Ba2+]i following introduction of an external solution containing 10 mM Ba2+ in the continued presence of Tg, recorded in WT (blue trace, n = 60) and Bcl-2 KO (red trace, n = 61) pancreatic acinar cells. Traces are shown with standard errors. Data in (A), (B), and (E) are presented as mean ± SEM.
(B) Bar chart comparing half-times (τ1/2) of the rise in Ba2+-induced Fura-2 ratio toward a plateau in WT (blue bar, n = 60) and Bcl-2 KO (red bar, n = 61) pancreatic acinar cells (shown in A).
(C) An AR42J cell doublet transfected with D1ER Cameleon. Blue fluorescence comes from the CFP component and yellow fluorescence from YFP.
(D) Results of immunoblotting against Bcl-2 performed on total protein isolated from (from left to right) control untransfected AR42J cells, AR42J cells stably transfected with pcDNA3 plasmid containing human Bcl-2 insert, AR42J cells transfected with control (scrambled) siRNA, and AR42J cells transfected with Bcl-2 siRNA. β-actin is shown as loading control. See also Figure S4 for distribution of Bcl-2 in pancreatic acinar cells and AR42J cells.
(E) Bar chart comparing differences in resting [Ca2+]ER, presented as the difference between basal YFP/CFP values and YFP/CFP values obtained after treatment with 20 μM CPA, normalized to controls. The gray bar represents control, untransfected AR42J cells (n = 78), the green bar represents cells transfected with pcDNA3 plasmid containing human Bcl-2 insert (n = 97), the blue bar represents AR42J cells transfected with scrambled siRNA (n = 69), and the red bar represents AR42J cells transfected with Bcl-2 siRNA (n = 62).