
Figure 4.
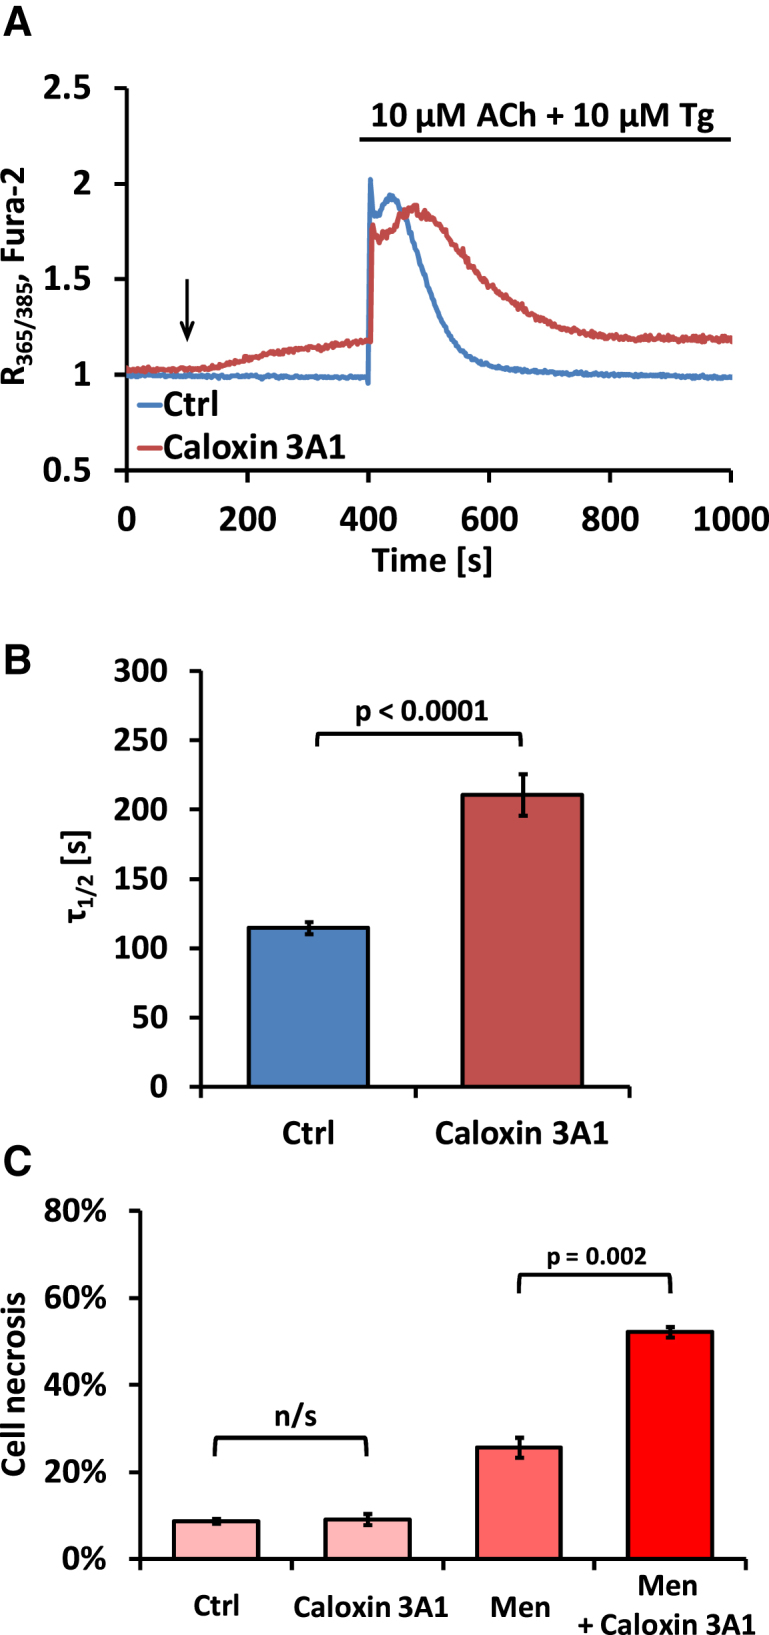
Specific Inhibition of PMCA Substantially Increases Necrosis in Pancreatic Acinar Cells
(A) Typical [Ca2+]i changes in response to 10 μM Tg and 10 μM acetylcholine (ACh) in an untreated pancreatic WT pancreatic acinar cell (blue trace) or a WT cell exposed to 1 mM caloxin 3A1 (dark red trace). Black arrow indicates time of caloxin 3A1 application. Note the gradual increase in [Ca2+]i after caloxin 3A1 application.
(B) Bar chart comparing half-times (τ1/2) of the reduction in [Ca2+]i to the resting level after responses to 10 μM Tg and 10 μM ACh in the presence (dark red bar, n = 26) or absence (blue bar, n = 15) of 1 mM caloxin 3A1. Error bars in (B) and (C) represent SEM.
(C) Bar chart comparing necrosis levels in WT pancreatic acinar cells under different conditions. Cells were incubated for 30 min in the presence of 1 mM caloxin 3A1, 30 μM menadione, or 1 mM caloxin 3A1 and 30 μM menadione. Control cells were incubated for the same amount of time, but without any treatment.