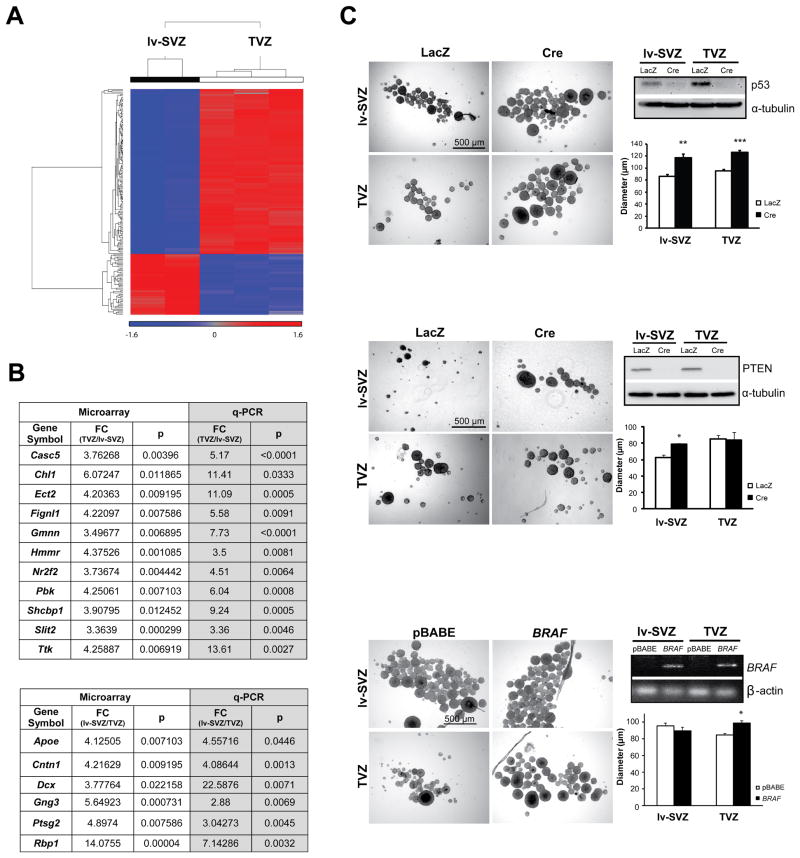
Figure 2. NSCs from the lv-SVZ and TVZ are molecularly-distinct progenitor populations with unique cell-autonomous responses to glioma-causing genetic mutations.
(A) SAM separates lv-SVZ and TVZ NSCs with the expression level represented as standardized values from −1.6 (blue, <1-fold change) to 1.6 (red, >1-fold change). No change (0 value) is denoted by grey. (B) Validation of select differentially-expressed transcripts by qRT-PCR with fold changes (FC) and p values (p) shown. (C) Increased neurosphere diameters were observed in NSCs from both the lv-SVZ and TVZ following p53. Increased neurosphere diameters were found only in lv-SVZ NSCs following Pten loss. Increased neurosphere diameters were observed only in TVZ NSCs following KIAA1549:BRAF expression (RT-PCR). Values denote the mean ± SEM. p*<0.01, p**<0.001, p***<0.0001. See also Figure S1.

