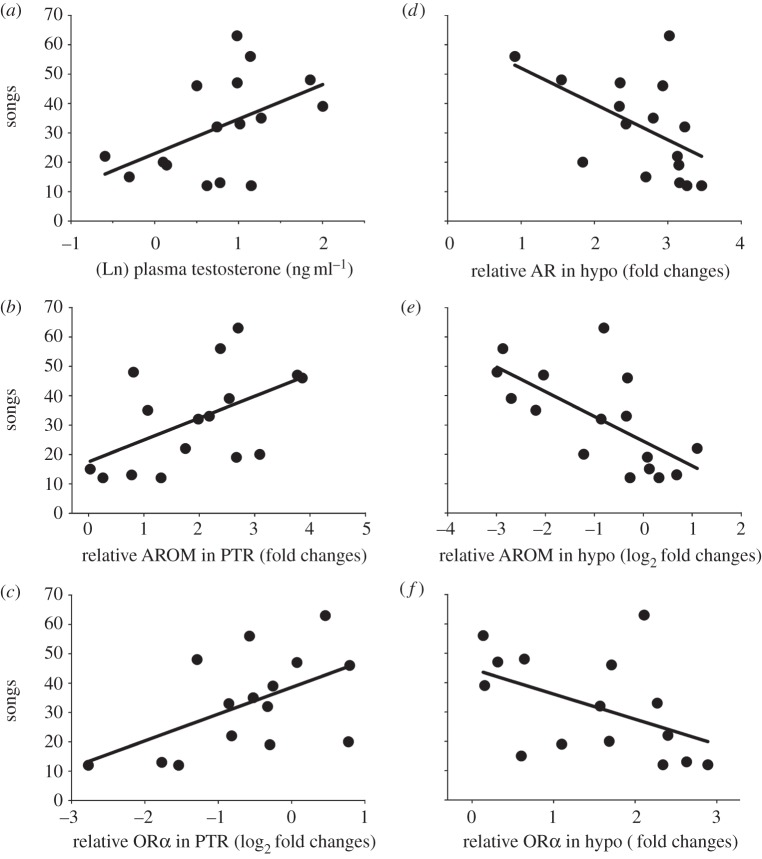
Figure 2.
Relationship between song and endocrine parameters: (a) plasma testosterone, (b) relative AROM mRNA in right posterior telencephalon (PTR), (c) relative ORα mRNA PTR, (d) relative AR mRNA in hypothalamus (hypo), (e) relative AROM mRNA hypo and (f) relative ORα mRNA hypo. Abundance of each target gene is expressed as fold changes relative to an arbitrary calibrator (calibrator = 1), or log2 fold changes (calibrator = 0), normalized by GAPDH.

