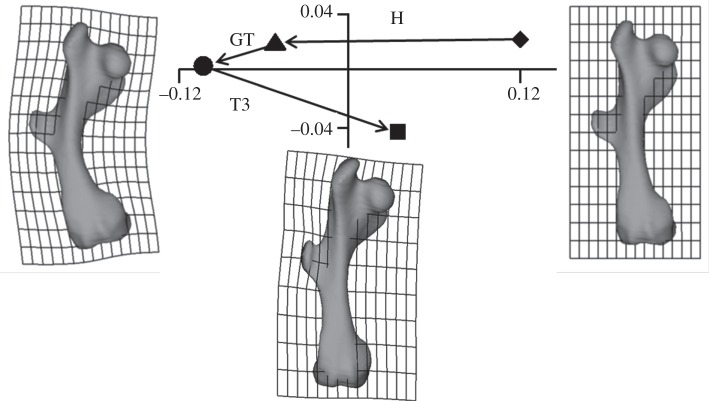
Figure 4.
Gluteus maximus analysis of the armadillo load cases. PC1 (90.3%) and PC2 (9.6%) from a size and shape space analysis of the coordinates of the 200 landmarks. The shapes to the left and right show the shape change in the model associated with PC1, and the shape below the plot indicates the deformation related to PC2. These deformations are exaggerated by a factor of approximately 100 to aid visualization. Diamond denotes unloaded; triangle denotes head load; circle denotes head plus greater trochanter load; square denotes head load plus greater trochanter plus T3 load.

