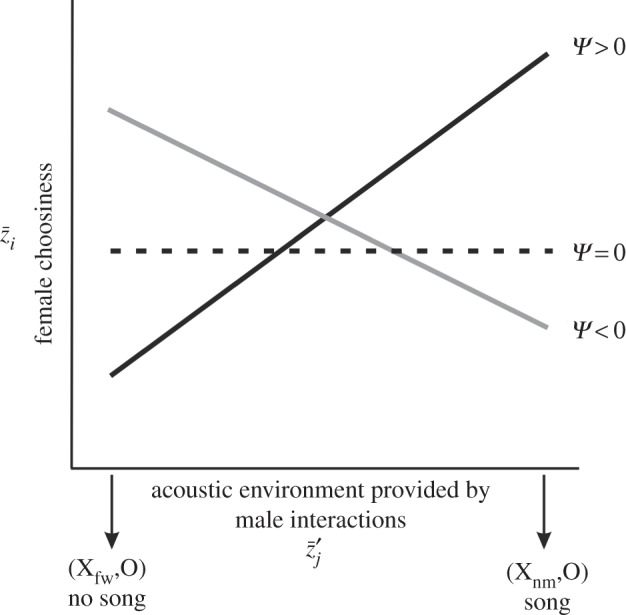
Figure 1.

The quantification and interpretation of the interaction coefficient Ψ in the present study. The y-axis indicates the focal female trait (choosiness,  ) averaged among a sample of females. The x-axis indicates the average acoustic environment experienced by those females (
 ). The prime (
 ) indicates that the male trait is expressed in an interacting partner or partners. The male genotypes that determine the interacting phenotype are indicated below the x-axis. The flatwing trait segregates as a sex-linked Mendelian trait, and T. oceanicus has an (X,X)/(X,O) sex determination system. Thus, the intensity of the acoustic environment scales with the proportion of flatwing alleles in a population. Hypothetical values of Ψ are indicated by the lines. A positive Ψ means that average female choosiness increases as the acoustic environment becomes noisier. In contrast, a negative Ψ describes a situation where females become less choosy with a noisier acoustic environment. When
  , the acoustic environment has no effect on female choosiness.
