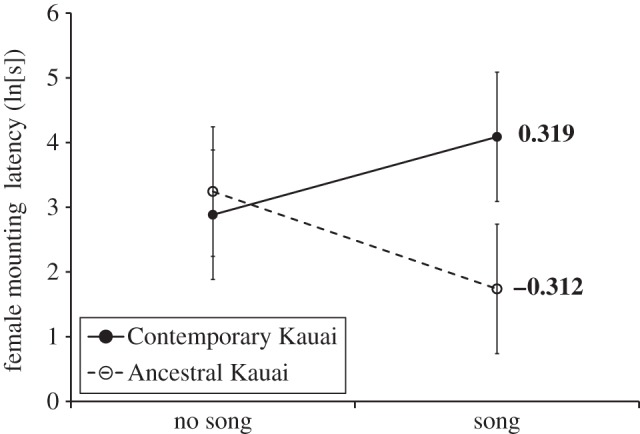
Figure 3.

The influence of acoustic experience on female choosiness in Ancestral Kauai versus Contemporary Kauai. Choosiness is indicated on the y-axis by natural log-transformed female mounting latency, and values of Ψ estimated from regression coefficients (see text for details) are indicated on the right. Both were significantly different from zero, as indicated in bold. Error bars represent one s.e. Filled circles with continuous line, Contemporary Kauai; open circles with continuous line, Ancestral Kauai.
