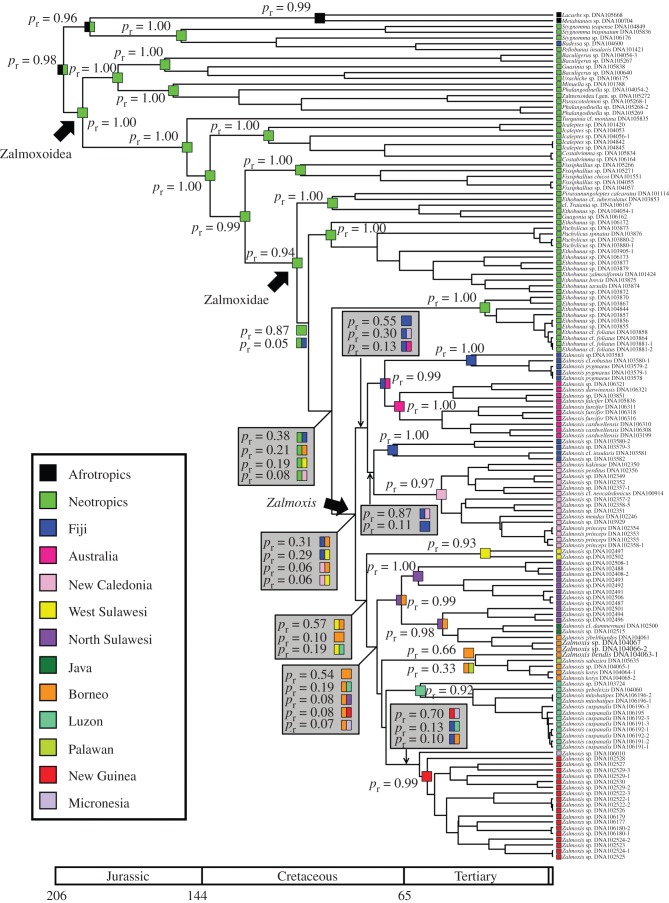
Figure 2.
Ancestral area reconstruction based on Bayesian inference analysis (from beast ver. 1.6.1) of all molecular data using lagrange. Coloured squares at terminals indicate ranges occupied by sampled species. Coloured squares at nodes indicate ranges reconstructed for hypothetical ancestors. Numbers on nodes indicate relative probability of ranges reconstructed.

