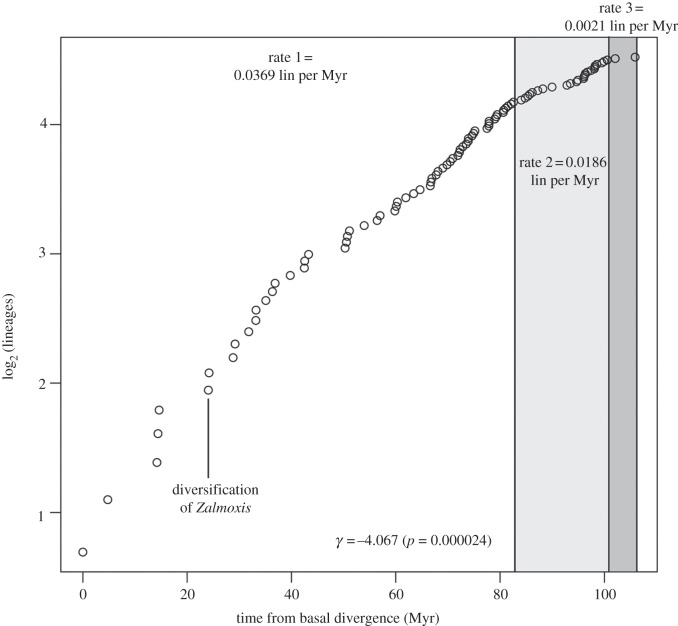
Figure 3.
Log-lineage through time plot of Zalmoxidae, indicating diversification rates and timing of rate shifts inferred by the optimal, Yule-three-rate model. Note that the second best model, a Yule-two-rate, infers the same timing of the first rate shift (ca 82.6 Myr from basal divergence) as the optimal model.

