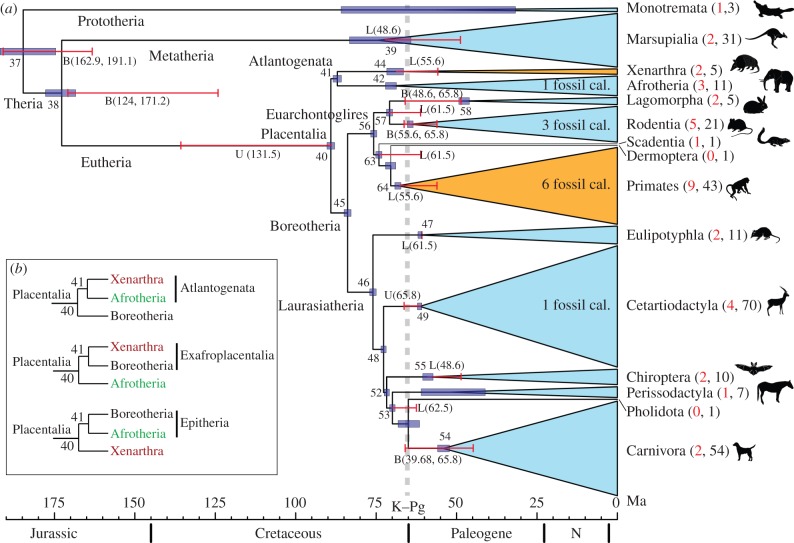
Figure 2.
The timetree of mammals. (a) Blue horizontal bars represent the posterior 95% CI for the node ages. Red horizontal bars represent fossil calibrations: U for upper (maximum), L for lower (minimum) and B for both. The number of species analysed is presented within brackets: red for nuclear and black for mitochondrial genomes. The two mammal orders that diversified before the K–Pg event are shown in orange. All orders within Afrotheria and Marsupialia diversified after the K–Pg event. The tree topology follows [26,27]. (b) The three possible topologies concerning the divergence of early Placentalia.

