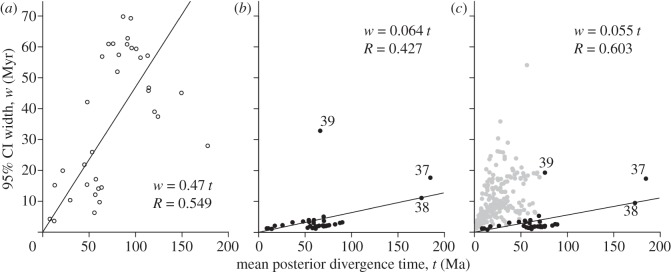
Figure 4.
Infinite-sites plot. The 95% CI width is plotted against the mean of the divergence time. (a) Prior calculated from a MCMC without sequence data on the 36-species tree. (b) Posterior calculated using 14 632 nuclear genes in 20 partitions, 36 species. (c) Posterior from combined analysis of 14 632 nuclear genes in 20 partitions and 12 mitochondrial genes for 274 species in one partition. In (c), black dots indicate nodes shared with the 36-species tree, and grey dots indicate nodes that are exclusive to the 274-species tree. Only black dots are used to fit the line and calculate R.

