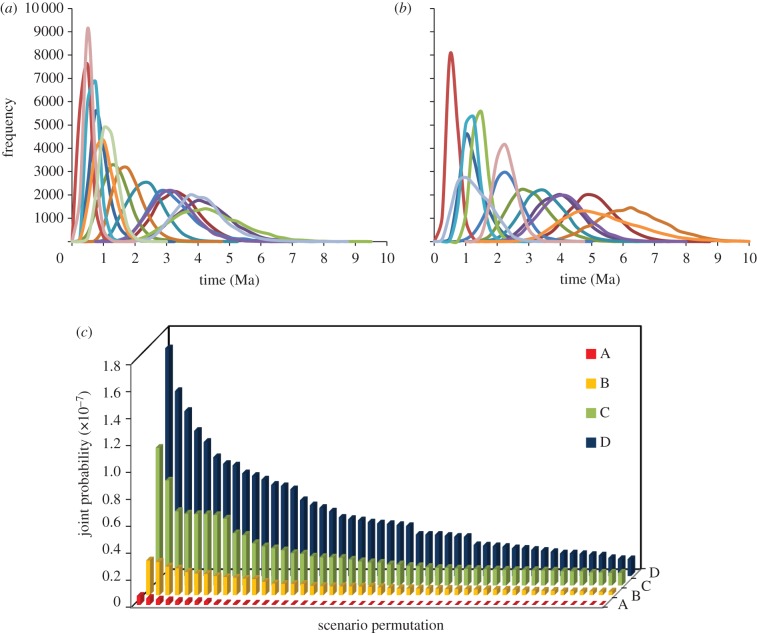
Figure 2.
Speciation times and speciation scenario probabilities. Posterior distributions of speciation times across the Isthmus of Panama in (a) humid and (b) dry pairs. (c) Rank of differing speciation scenarios. The coloured models (c) represent four different scenarios that differ by the number of unique intervals. The scenarios represent a continuum of completely overlapping intervals or time periods (scenario A; red) to temporally unique intervals among habitat groups (scenario D; blue). On the x-axis are the top 50 permutations and on the y-axis is the joint probability of each permutation.

