
Figure 4.
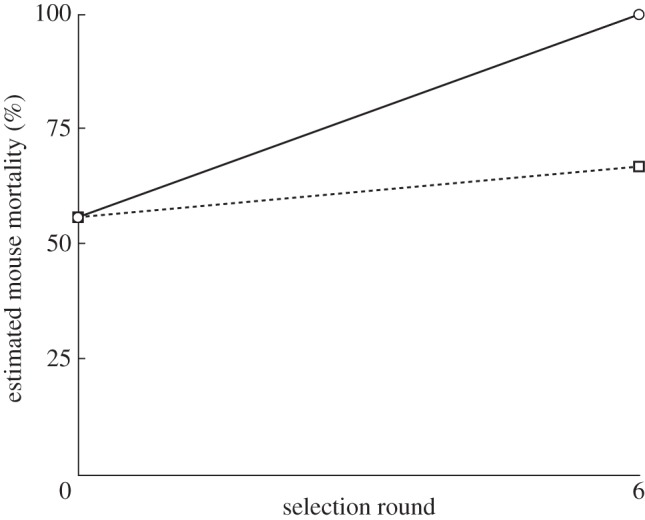
Kin selection and virulence. Shown is the predicted mouse mortality rate, 5 days after infection, at the start and end of our selection experiment. A higher relatedness favours QS, which facilitates bacterial growth and hence leads to higher virulence. Circles denote high relatedness, whereas squares denote low relatedness.