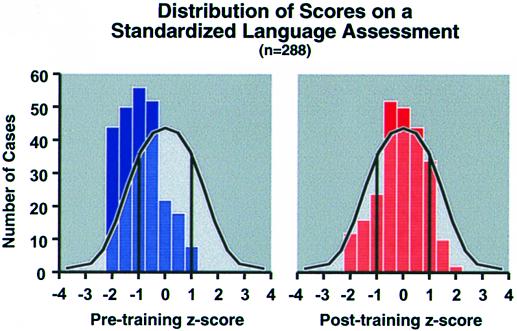
Figure 2.
Pretraining and posttraining frequency histograms using Z scores (test of auditory comprehension of language-revised) superimposed onto shaded bell curves representing normal distribution of scores for this test. Z scores of −1 equal 1 SD below mean, +1 equals 1 SD above mean. Number of cases scoring in each Z score bin is plotted before and after 4–8 weeks of FastForWord training. The number of children performing at or above the median improved significantly from 11% pretraining to 39% posttraining (F = 26.3, P < 0.0001). Figure used with permission of Miller et al. (Miller, S. L., DeVivo, K., LaRossa, K., Pycha, A., Peterson, B. E., Tallal, P., Merzenich, M. M. & Jenkins, W. M., Society for Neuroscience Meeting, November 7–12, 1998, Los Angeles, CA).

