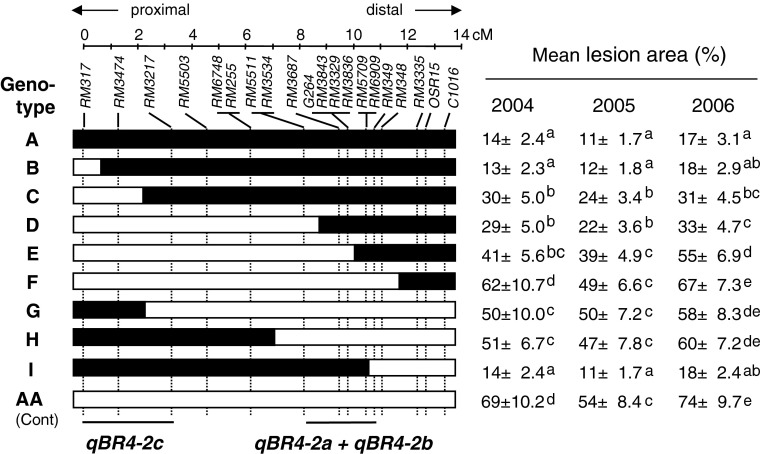
Fig. 2.
Genetic linkage map and graphical genotypes of sub-CSSLs around qBR4-2. Black bars indicate chromosome regions derived from the resistant Owarihatamochi; white bars indicate those derived from the susceptible Aichiasahi. The locations of qBR4-2a/qBR4-2b and qBR4-2c, indicated at the bottom, are based on the phenotypic data tabulated on the right

