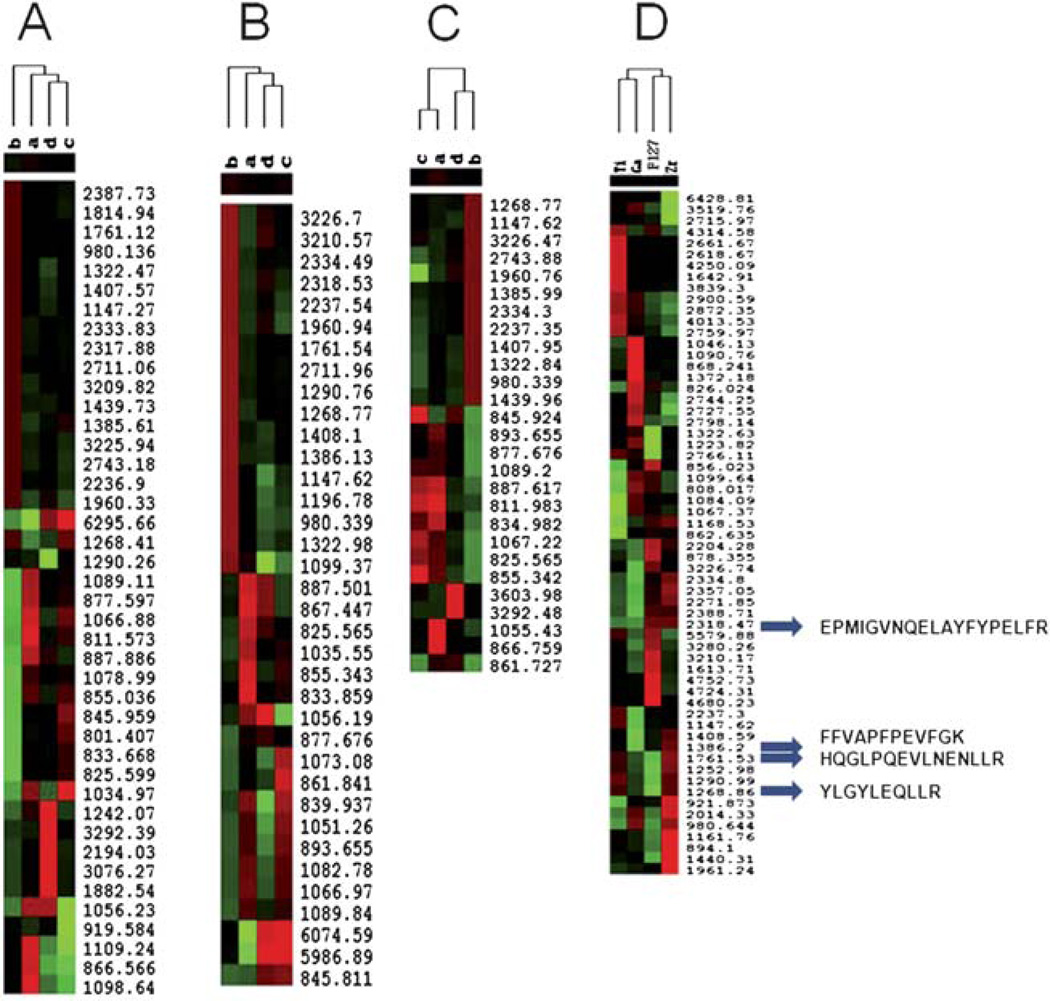
Fig. 6.
Unsupervised hierarchical clustering analysis for the ability of the MPS chips immobilized with different metal ions for LMW phosphopeptide recovery (Cluster A: Zr4+, Cluster B: Ga3+, and Cluster C: Ti4+). Red indicates peak intensity higher than the median value, green indicates peak intensity lower than the median value, and black represents peak intensity equal to the median values. Each row represents an individual MALDI MS mass peak and each column represents a type of fractionated sample, with an unprocessed phosphopeptide sample as a negative control. The samples are divided by (a) raw α-Casein, (b) trypsinized α-Casein, (c) trypsinized α-Casein treated with phosphatase, (d) raw α-Casein treated with phosphatase. Cluster D shows phosphopeptide enrichment by the three MPS chips immobilized with Zr4+, Ga3+, Ti4+ and the control MPS chip prepared by Pluoronic F127.

