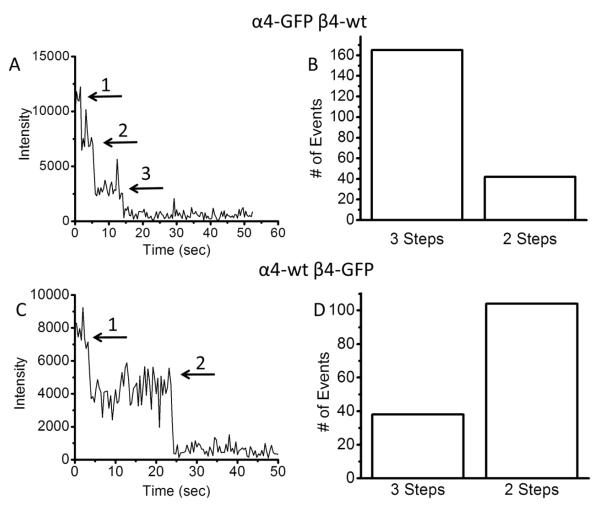
Figure 3. Single step bleaching of labeled subunits in N2a cells cultured on ZMW arrays.
A. Time course of fluorescence intensity from a ZMW in a dish containing N2a cells transfected with α4-GFP + β4-wt. The trace shows three bleaching steps as indicated by the arrows. The different fluorescence levels are separated by clear steps until all the GFP molecules bleach to the background level. B. Number of three-step and two-step bleaching events observed for α4-GFP + β4-wt showing predominantly three bleaching steps. This indicates primarily (α4)3(β4)2 stoichiometry. C. Time course of fluorescence intensity from a well in a dish transfected with α4-wt + β4-GFP. The time trace shows two bleaching steps as indicated by the arrows. D. Number of three-step and two-step bleaching events observed for α4-wt + β4-GFP showing predominantly two bleaching steps. This also indicates primarily (α4)3(β4)2 stoichiometry.

