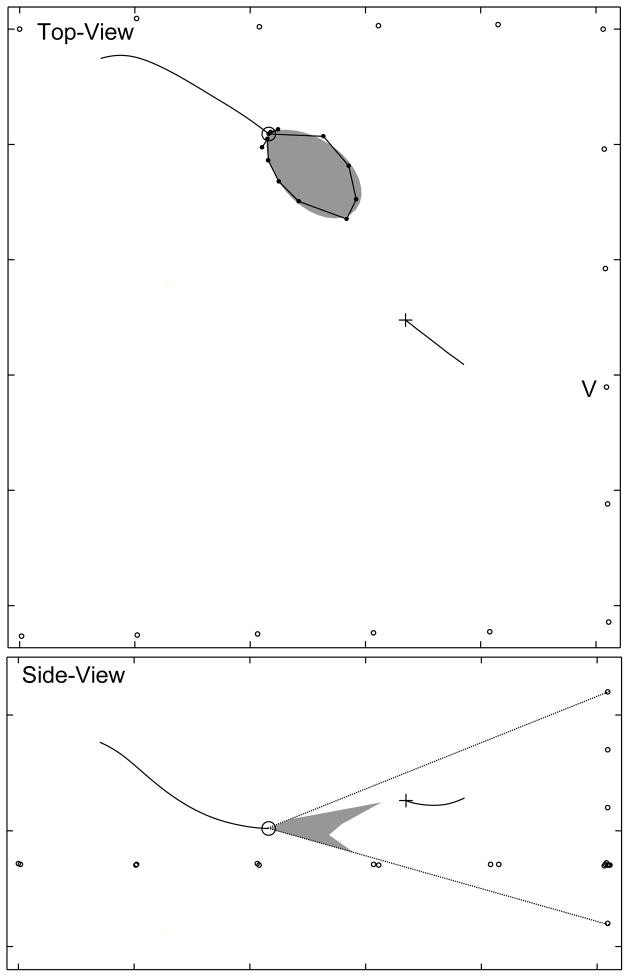
FIG. 2.
The sonar beam of flying E. fuscus has a vertical notch. Top panel: The small black circles are the positions of the array microphones, the black line is the flight path of the bat, the black circle is the current position of the bat. The dark gray polar plot represents the smoothened profile of the horizontal sonar beam, with radius proportional to normalized intensity. The black dots joined by a line are the unsmoothened measured intensities. The black line is the trajectory of the tethered insect and the black cross is the present position of the insect. The position of the vertical array is indicated by the label ’V’. Bottom panel: Polar plot of the vertical section of the sonar beam recorded by the vertical array (Gray polygon). Dotted lines show the angular limits of the vertical array measurement. The bat is producing pulses at a slow repetition rate (<20 Hz) at this stage.

