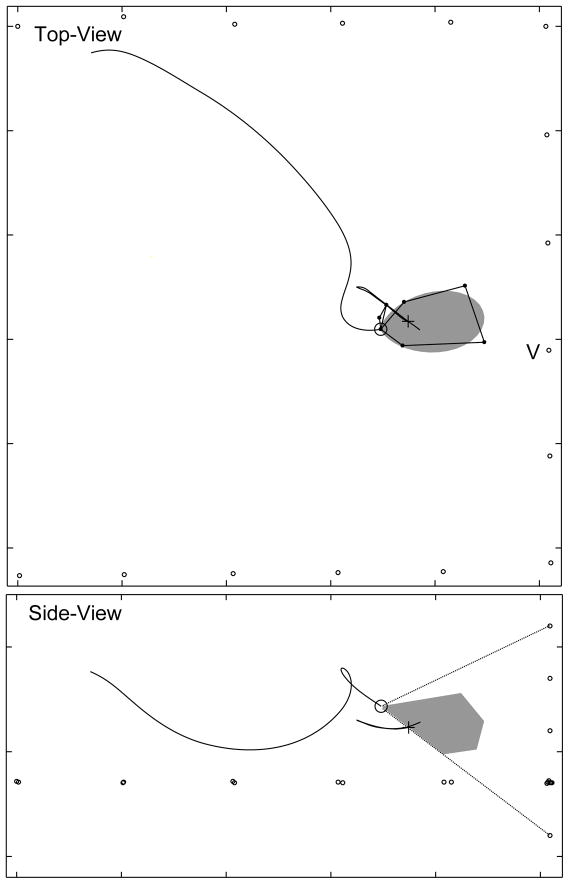
FIG. 3.
The bat may move its sonar beam up and down. This figure shows a sonar beam pattern approximately 1 s after the vocalization shown in Fig. 2. The top-view panel shows that the bat is responding to the target by adjusting its flight path and that the horizontal aspect of the beam is locked to the target. The side-view panel shows no evidence of a notch in the beam. If the bat’s sonar beam had two prominent lobes in the vertical plane and if the bat was directing its sonar beam down at the target (black cross) such that the location of the lower lobe is below the lower angular limit of the array (black dotted lines) this is the expected shape of the recorded sonar beam cross-section.

