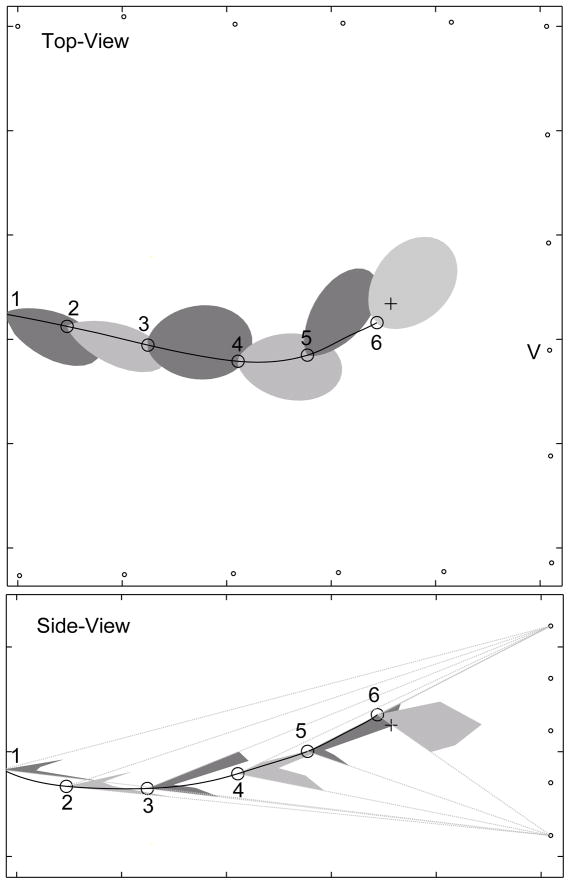
FIG. 4.
The bat may move its beam up and down to track the target. This figure shows some vocalizations from bat #1 during a prey interception. To improve clarity not all vocalizations in the train produced by the bat are shown in the diagram. The top-panel shows horizontal cross-sections of the sonar beam, bottom-panel shows vertical cross-sections. Dotted lines in the bottom panel show the “field-of-view” of the vertical array. Vocalization samples 1 to 4 were produced at a low rate (<20 Hz) while 5 and 6 are taken from a train of pulses produced at a high rate (>100 Hz). Samples 1 to 5 show a prominent notch in the vertical cross-section, while the notch is absent in 6. The bat is responding to the target during 5 and 6, and is swooping down on the target during 6. In the side-view the horizontal array is omitted for clarity.

