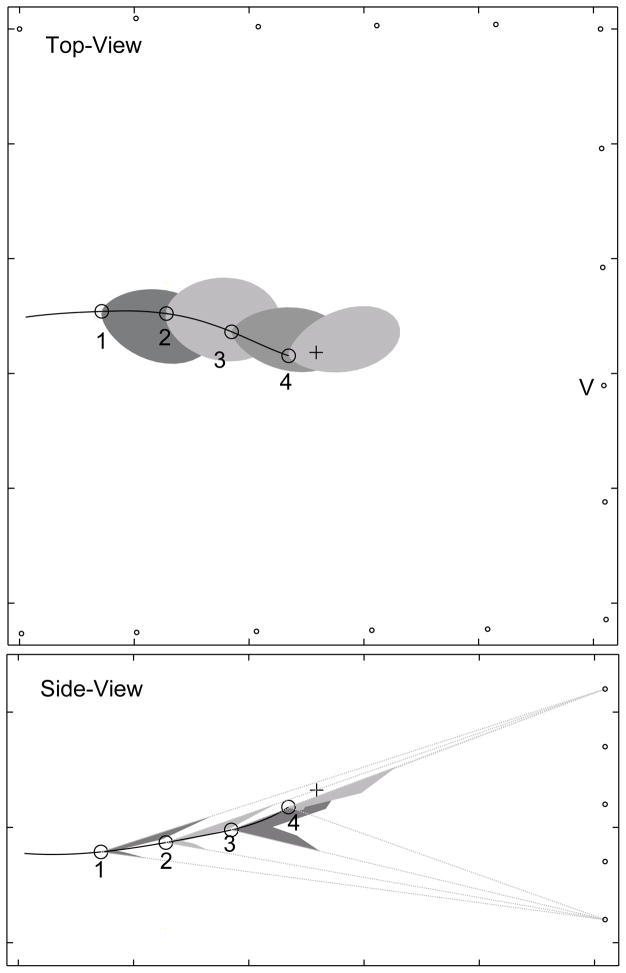
FIG. 5.
A sequence of beam-patterns from bat #2. Beam pattern samples 1 to 3 show the notched beam pattern in the vertical array. The bat is producing signals at a low rate (<20 Hz) during patterns 1 and 2, and a high rate (>100 Hz) during patterns 3 and 4. The notch disappears from the recording for sample 4, consistent with the hypothesis the bat is directing its sonar beam up towards the target (black cross).

