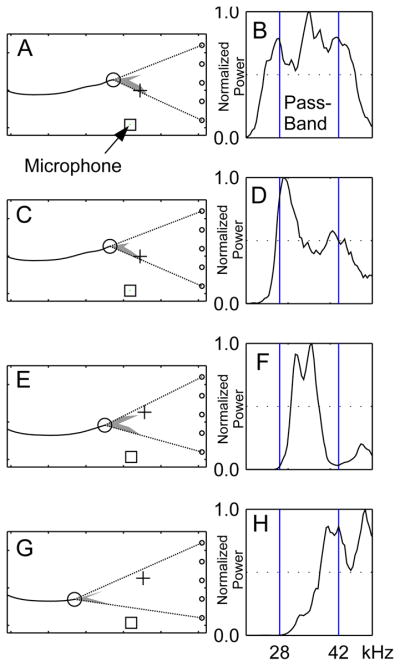
FIG. 7.
Control for bandwidth. A)C)E)G) Examples of notched sonar beam patterns emitted by the bat. B)D)F)H) Power spectra (linear scale) of the corresponding bat calls. The band-width of the filter used for the envelope extraction is indicated by vertical lines on the power spectra plots. Power spectra of the call spans: B) the entire pass-band, D) the lower end, F) the middle and H) the higher end of the envelope-detectors. The black square shows the position of the ultrasonic microphone from which the spectra are generated.

