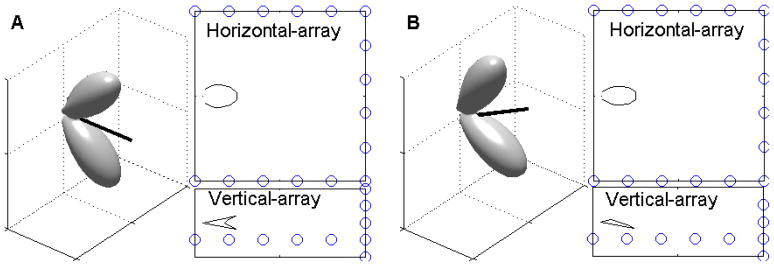
FIG. 9.
Simulated array measurements of the three-dimensional model. A) The model beam is oriented at 0 degrees, such that the two lobes are symmetrically above and below the horizontal plane (three dimensional plot). The simulated measurement from the horizontal array (top-panel) shows a single lobe. The simulated measurement from the vertical array (bottom-panel) shows a notched pattern. B) The model beam is oriented up by 30 degrees. The simulated measurement from the vertical array only captures part of the lower lobe.

