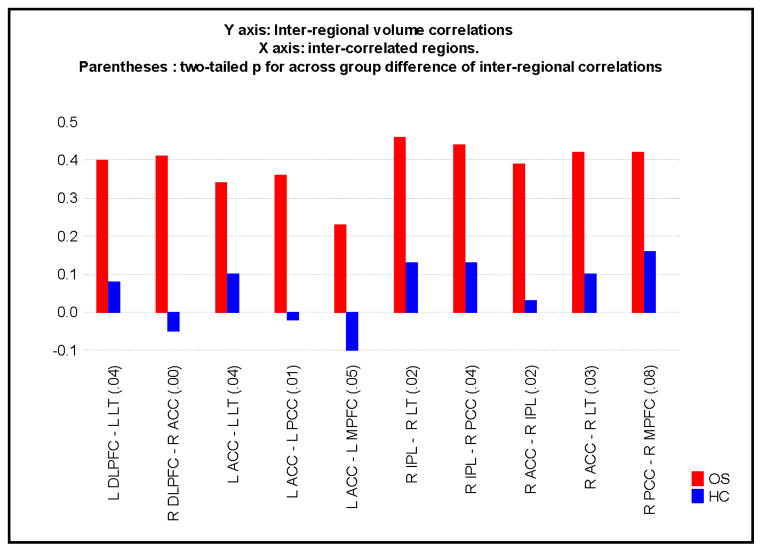
FIGURE 1.
Inter-regional correlations for each group for each pair of regions are depicted. The X-axis denotes each pair of inter correlated regions. Inter-regional correlations are plotted on the Y-axis with the height of the bars equaling the magnitude of the inter-regional correlation for that pair of regions. Red and blue bars denote inter-regional correlations for OS and HC respectively. While the correlations in OS were significant, none of the inter-correlations for HC reached significance. All inter-regional correlations except that for the L ACC- L MPFC region-pair were significant at p < 0.05 (two tailed) in OS subjects. Inter-correlations for none of the region-pairs in HC subjects reached significance. Difference of r tests comparing the inter-regional correlations between OS and HC were performed and the two tailed p values for these across group difference for inter-regional correlations are provided in parentheses on the X-axis. MPFC = medial prefrontal cortex, ACC = anterior cingulate cortex, PCC = posterior cingulate cortex, IPL= inferior parietal lobule and DLPFC = dorso lateral prefrontal cortex. LT= Lateral temporal cortex

