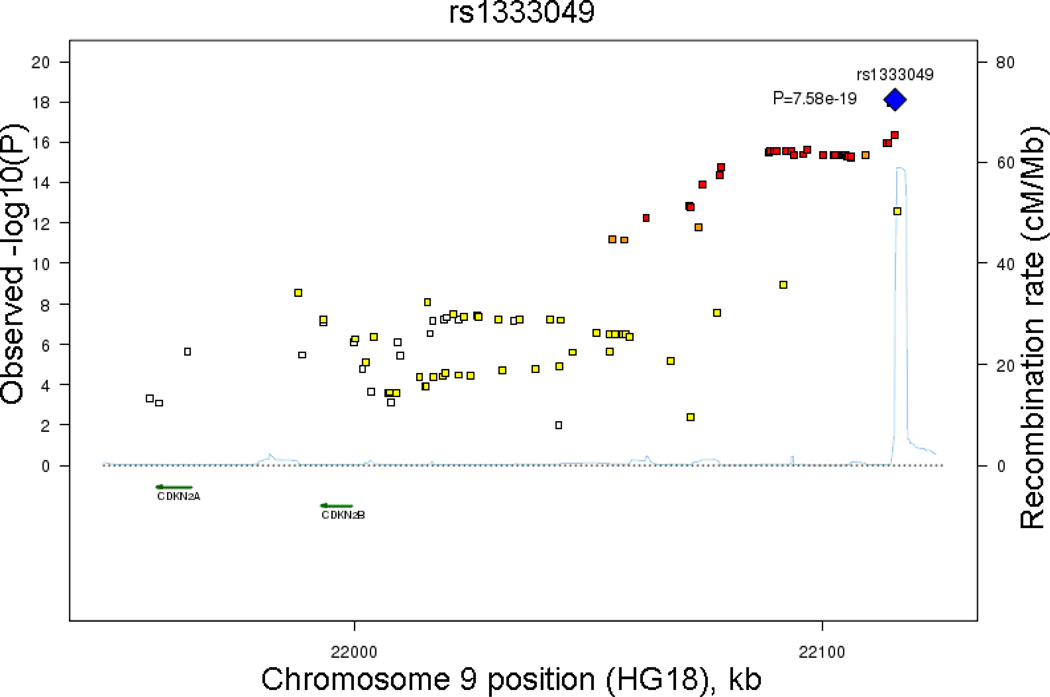
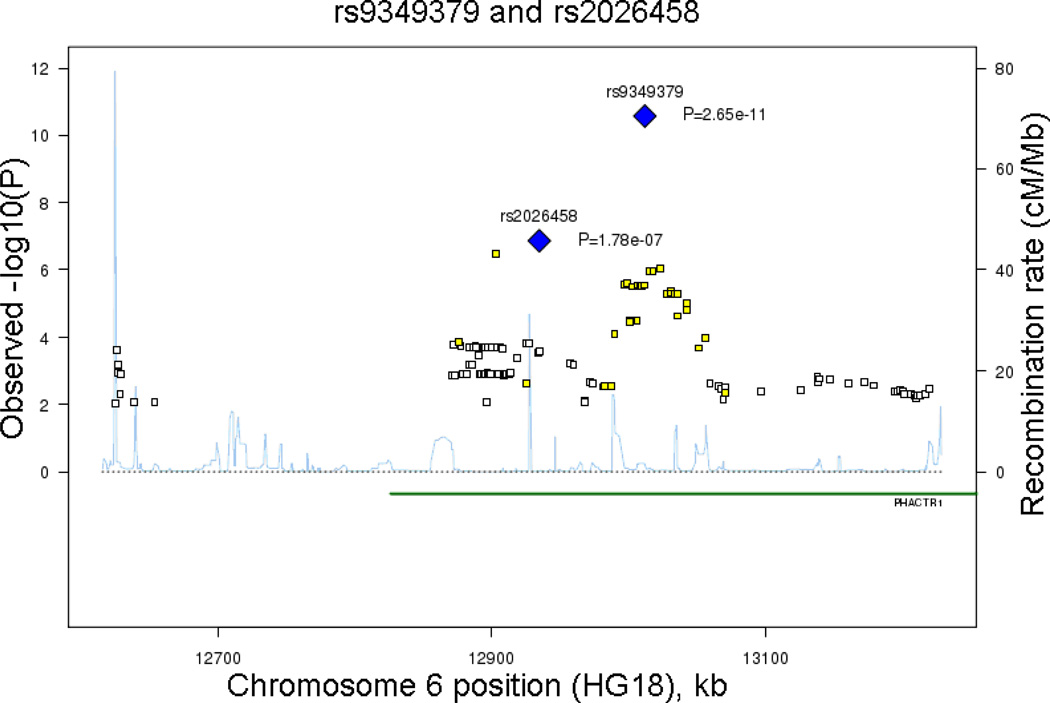
Figure 2.
Observed –log(P) and recombination rates by chromosomal position for all associated SNPs nearby (a) rs1333049 near CDKN2B on 9p21.3 and (b) rs9349379 near PHACTR on 6p24. Results from the genome-wide association analysis of SNPs versus age and sex-adjusted CAC quantity in the meta-analysis of five independent discovery cohorts. Association plots were conducted using SNAP.[27] Top SNPs of interest and P values in each region are indicated (blue diamonds). Color coding indicates the strength of LD of each SNP with the top SNP in each region: red (r2≥0.08), orange (r2≥0.5), yellow (r2≥0.2), white with no color (r2<0.2).


