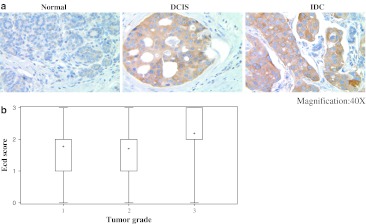
Fig. 2.
a Analyses of Ecd expression in normal, DCIS and IDC breast tissues. Representative specimens (from Table 1) for Ecd staining are shown with magnification of ×40; b Correlation of Ecd expression in samples from cohort 1 with IDC tumor grade is shown. The distribution of IDC samples was: grade 1 = 18, grade 2 = 34, and grade 3 = 52, analyzed by Kruskal–Wallis test

