
Fig. 4.
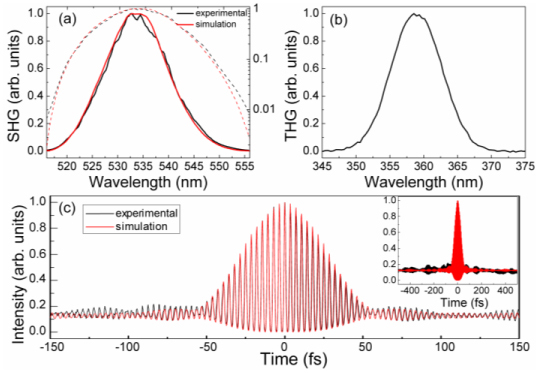
(a) Experimental and calculated SHG spectra shown in linear (solid line) and log-10 (dash line) scales. (b) Experimental THG spectrum obtained by focusing TL pulses at the surface of a glass slide. (c) Experimental and calculated interferometric autocorrelation traces for compressed laser pulses on the range of −150 fs to 150 fs. Insert: Same data on the range of −500 fs to 500 fs.