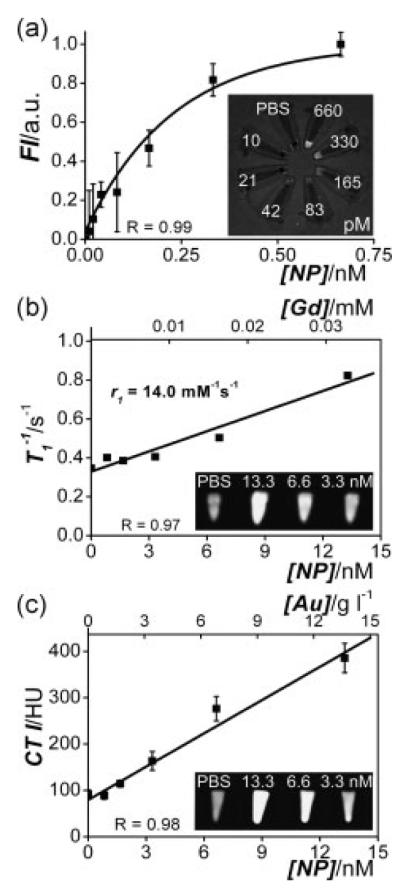
Figure 2.
Concentration–signal curves of the lipid-coated gold/silica particles for (a) FI, (b) MRI and (c) CT. Note that both nanoparticle concentrations and the corresponding Gd and Au concentrations are given. The molar longitudinal relaxivity r1 of the gadolinium in the lipids was found to be 14.0 mM−1 s−1 and the slope in the CT curve was 23 HU per g gold l−1 solution. The inset in each panel shows the corresponding image of nanoparticle dilution series (concentrations indicated) associated with each imaging modality, revealing the high sensitivities of all three imaging techniques. Reproduced with permission.[62]

