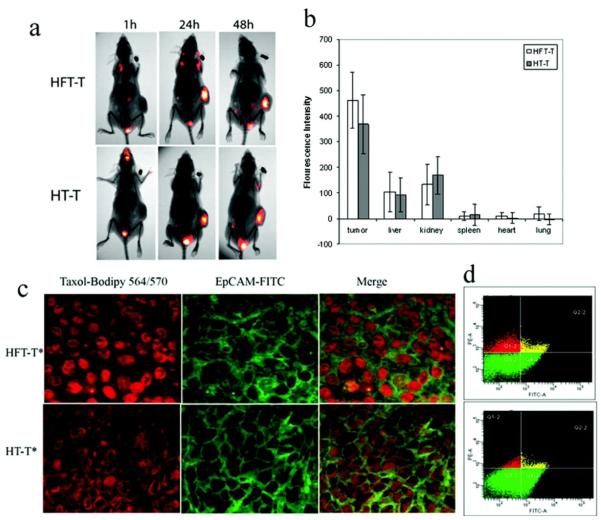
Figure 6.
In vivo distribution of HFT-T in KB-3-1 tumor-bearing mice. Near infrared dye (cy5.5)-labeled HFT-T or HT-T was injected i.v. into KB-3-1 tumor-bearing mice. (a) Imaging of mice at 1, 24, and 48 h after injection. (b) Biodistribution of HFT-T and HT-T in major organs at 48 h after injection. (c) The cellular internalization of HFT-T versus HT-T in KB-3-1 xenografts 24 h after injection (i.v.). HFT-T showed marked internalization in KB-3-1 cells identified by human EpCAM expression (green). In contrast, HT-T showed much less internalization by KB-3-1 cells and was predominantly found in the extracellular space. (d) Flow cytometry analyses of cells obtained from disaggregated KB-3-1 xenografts 24 h after i.v. injection of HFT-T or HT-T. Two-dimensional event density plots of disaggregated tumor cell suspensions from animals injected with HFT-T or HT-T. The cells were stained with anti-EpCAM Ab-FITC conjugate to identify human cancer cells. The cells in Q4-2 and Q2-2 were human tumor cells (EpCAM positive), the cells in Q1-2 and Q2-2 contained nanoparticles (bodipy 564 positive), and the cells in Q2-2 were human tumor cells containing nanoparticles (double positive). Reproduced with permission.[136] Copyright 2009, American Chemical Society.

