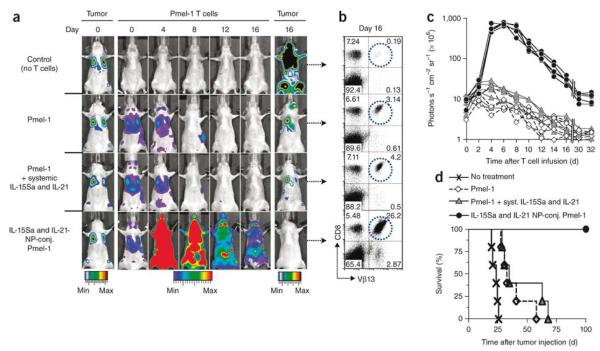
Figure 9.
Lung and bone marrow tumors were established by tail vein injection of 1 × 10⁶ extG-luc–expressing B16F10 cells into C57BL/6 mice. Tumor-bearing mice were treated after 1 week by sublethal irradiation followed by i.v. infusion of 1 × 10⁷ CBR-luc–expressing Vβ13+CD8+ Pmel-1 T cells. One group of mice received Pmel-1 T cells conjugated with 100 nanoparticles per cell carrying a total dose of 5 μg IL-15Sa and IL-21 (4.03 μg IL-15Sa + 0.93 μg IL-21); control groups received unmodified Pmel-1 T cells and a single systemic injection of the same doses of IL-15Sa and IL-21 or Pmel-1 T cells alone. (a) Dual longitudinal in vivo bioluminescence imaging of extG-luc–expressing B16F10 tumors and CBR-luc–expressing Pmel-1 T cells. (b) Frequencies of Vβ13+CD8+ Pmel-1 T cells recovered from pooled lymph nodes of representative mice 16 d after T cell transfer. (c) CBR-luc T cell signal intensities from sequential bioluminescence imaging every 2 d after T cell transfer. Every line represents one mouse, with each dot showing the whole-mouse photon count. (d) Survival of mice after T cell therapy illustrated by Kaplan-Meier curves. Shown are six mice per treatment group pooled from three independent experiments. Reproduced with permission.[176] Copyright 2010, Nature Publishing Group.

