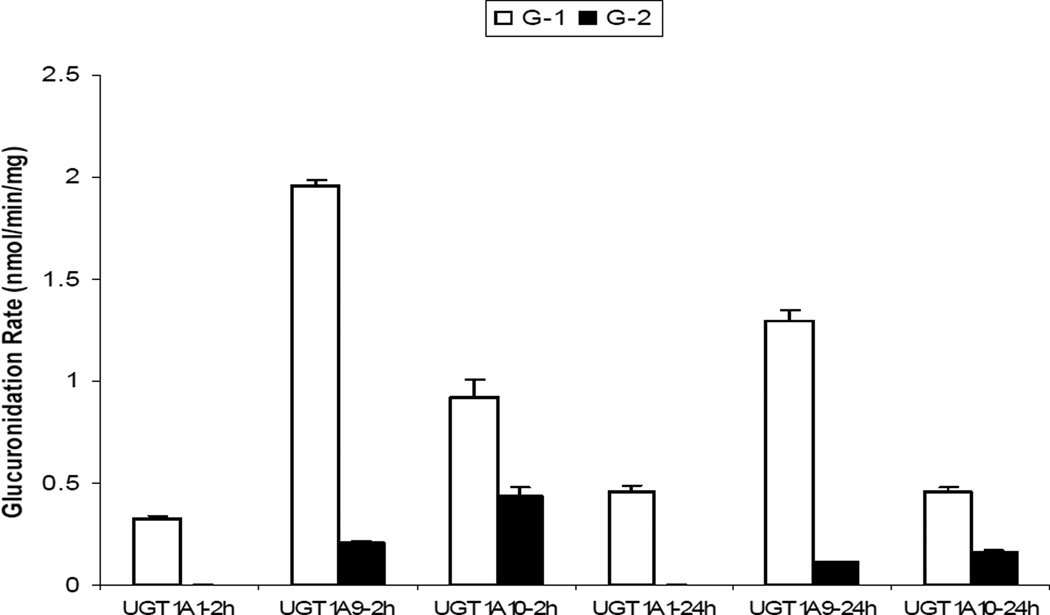
Figure 3.
Genistein glucuronidation in recombinant human UGT isoforms. The open bars represent the formation rates of genistein glucuronide-1 (G-1) in UGT1A1, 1A9 and 1A10 after incubation times of 2 h and 24 h, respectively. The black bars represent the formation rates of genistein glucuronide-2 (G-2) in UGT1A1, 1A9 and 1A10 after incubation times of 2 h and 24 h, respectively. It was determined that G-1 was G-7-G and G2 was G-4’-G as described in the “results” section. Each bar represents the average of three determinations and the error bar is the standard deviation of the mean.

