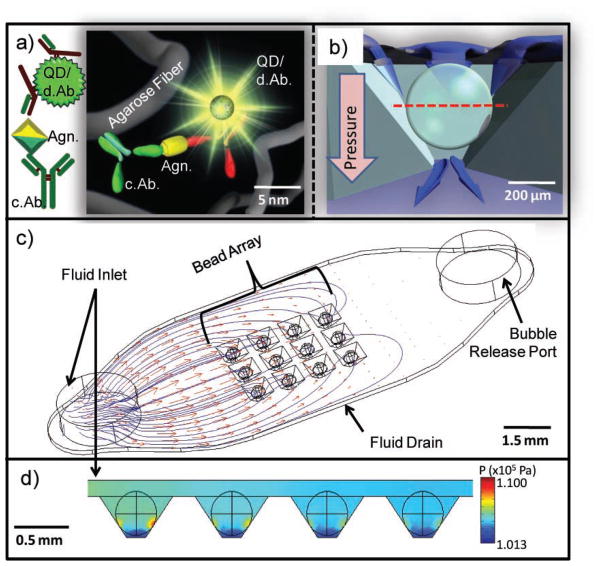
Figure 2.
PBNC construction. a) Immunoreagents, signaling particles, and agarose fibers are assembled on the nanometer scale and form the micrometer-sized bead reactor. Detecting antibodies are labelled d.Ab. and capture antibodies are labelled c.Ab. b) Cross section of the bead in the chip container with a red line indicating the optical section used in subsequent confocal images (note pressure gradient). c) CFD model visualizing particle streamlines and velocity profiles with an inlet velocity of 1600 μL min−1 show nonuniform delivery of fluids to the bead array. d) High pressure is localized at the bead–well contact points with a well-to-well RSD of 12.6%. The units of the color scale bar are kPa.

