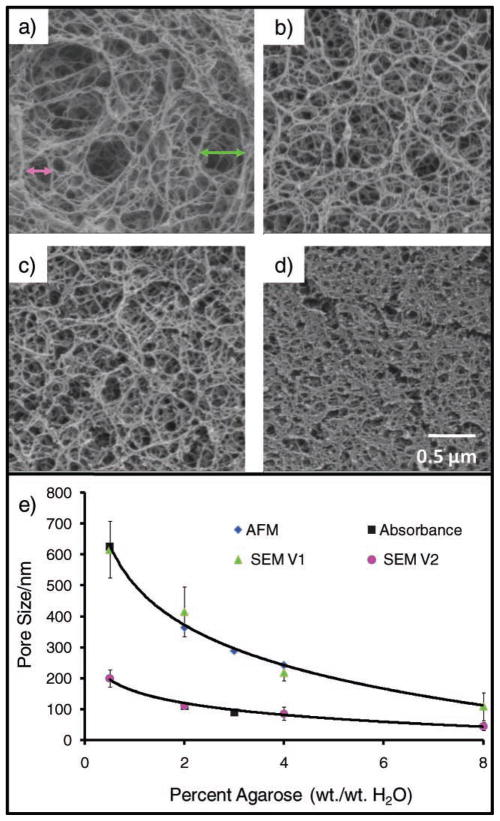
Figure 7.
Weight percentage of agarose determines porosity. The beads’ pore size is tunable by selecting the weight percentage of agarose used during synthesis. Here, SEM images for beads of a) 0.5, b) 2.0, c) 4.0, and d) 8.0% illustrate the decrease in pore size as a function of the increasing agarose concentration. Pore-size estimates are based on distances between adjacent agarose fibers. The green and pink arrows in (a) indicate representative measurements used to construct the green and pink curves in e) the plot of pore size as a function of weight percentage of agarose and contrasted with alternative measurement approaches. AFM gives a tight cluster of pore sizes between 200–400 nm,[45] while spectroscopy experiments (absorbance) show a exponential decay.[53] The SEM data correlate to an exponential reduction in pore size with increasing agarose concentrations and correspond with the AFM values.

