Fig. 3.

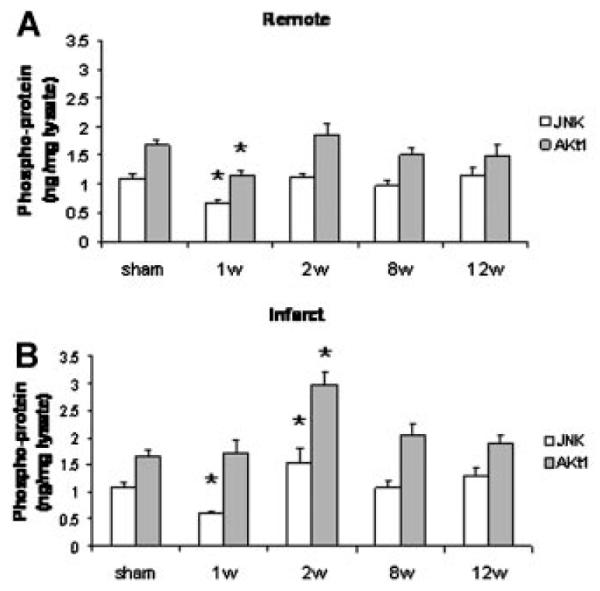
Myocardial JNK (white bars) and Akt (gray bars) activation in the remote (A) and in the infarct/borderzone (B) myocardium after myocardial infarction. n = 4–9, *P < 0.05 vs. normal control.

Myocardial JNK (white bars) and Akt (gray bars) activation in the remote (A) and in the infarct/borderzone (B) myocardium after myocardial infarction. n = 4–9, *P < 0.05 vs. normal control.