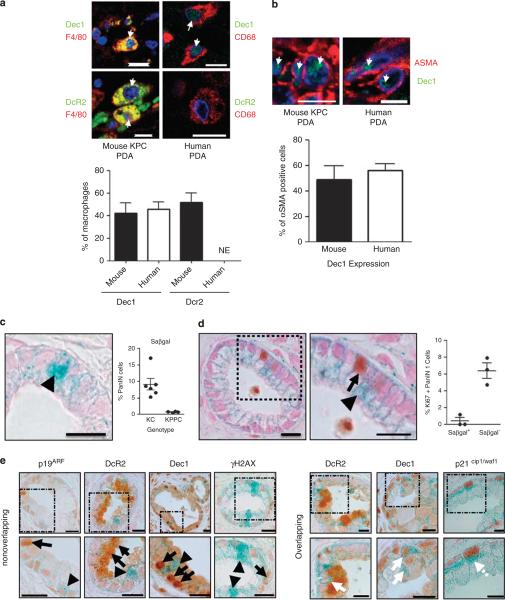
Figure 3.
SAβgal labels a small population of growth-arrested PanIN cells. After heat-mediated antigen retrieval in 0.01 m sodium citrate for 12.5 min and blocking in donkey serum for 30 min, two primary antibodies were applied together overnight. The next day, secondary antibodies conjugated to the appropriate fluorophore were applied for 30 min at 37 °C, followed by two washes in phosphate-buffered saline (PBS) and mounting in Prolong Gold antifade reagent containing 4,6-diamidino-2-phenylindole. (a) Dec1 (green) is found in a significant fraction of murine and human tumor-associated macrophages. DcR2 (green) is found in murine, but not human tumor-associated macrophages. NE, not expressed (human N=5, mouse N=4). Arrows denote double positive cells. (b) Coimmunofluorescence for Dec1 (green) and αSMA (red) shows Dec1 is expressed in cancer-associated fibroblasts. Quantification is shown below. Scale=10 μm. Error bar indicates s.e.m. (c) Freshly dissected pancreas was cut into 1-3 mm pieces and fixed in 4% paraformaldehyde (PFA) (pH 6.0) for 2 h on ice. Samples were washed with PBS and tissue was incubated overnight in SAβgal staining solution at 37 °C. The following day, the samples were washed with PBS then fixed in 10% formalin overnight. The next day the tissues were washed with PBS and processed using reduced xylene exposure times. 4 μm sections were cut, counterstained with nuclear fast red (Sigma, St Louis, MO, USA) and coverslipped for immediate imaging or first subjected to immunohistochemistry. Representative image of SAβgal stain (left). Arrowhead denotes Saβgal-positive cell. SAβgal expression in KC PanIN and conditional biallelic deletion of Trp53 rescues the majority of PanIN SAβgal content (right). Each dot represents the average of at least five images for a single mouse of the indicated genotype. (d) Slides were dewaxed in xylenes (1 min shaking) and rehydrated in 100% ethanol (40 s shaking) and 70% ethanol (20 s shaking). Antigen unmasking was performed in 10 mm sodium citrate buffer, pH 6.0. Immunohistochemistry was performed as described above with the exception that slides were counterstained for 10 s with nuclear fast red (Sigma). Ki67 immunohistochemistry overlaid on SAβgal stained KC PanIN tissue reveals a mutually exclusive staining pattern (inset at right). Arrowhead denotes SAβgal positive cells. Arrow denotes Ki67 positive cell. Scale 200 μm. Quantification demonstrating SAβgal is largely excluded from Ki67-positive cells at the right. (e) Additional putative OIS biomarkers are not enriched in SAβgal expressing PanIN cells. Arrows denote OIS-associated biomarker-positive cells. Arrowheads denote SAβgal-positive cells. White arrows denote OIS/SAβgal double-positive cells. Scale=200 μm.

