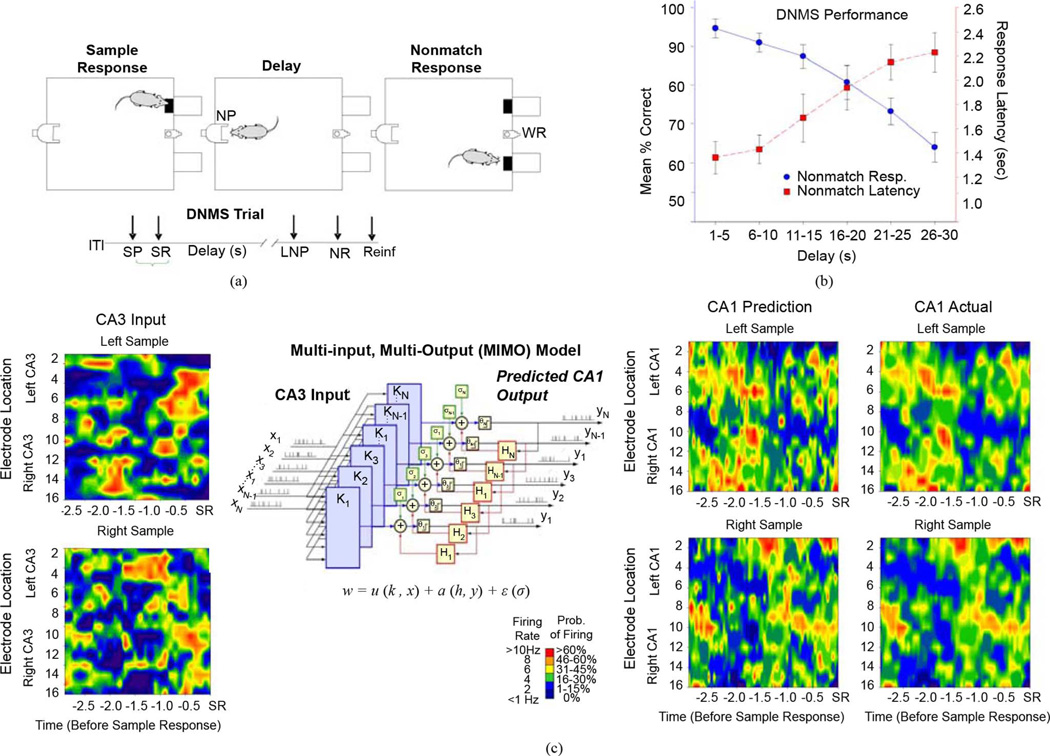
Fig. 1.
DNMS task and associated hippocampal ensemble activity. (a) DNMS trial diagram of SR, Delay, and NR for water reward (WR) Timeline below indicates sequence of phases in the task: intertrial interval (IT); Sample Presentation (SP); Sample response (SR); Delay interval (Delay); last nosepoke (NP) during Delay (LNP); Nonmatch response (NR); Reinforcement (water reward) (Reinf.). (b) DNMS performance for 15 animals. Blue trace indicates mean ± S.E.M. % correct Nonmatch Responses on DNMS trials sorted according to length of delay (in 5 s increments). Red Trace indicates latency to perform the Nonmatch Response on the same trails. (c)MIMO nonlinear model analysis of DNMS generated hippocampal ensemble activity. Left: Color contours depict ensemble firing from 16 CA3 neurons (8 per hemisphere) recorded up to 3.0 s prior to the SR on Left (upper) or Right (lower) DNMS trials. Center: Schematic of MIMO model. CA3 input spike trains X1 − Xn predict CA1 output spike trains Y1 − Yn at right. The input–output relationship between CA3 and CA1 is modeled b parallel MISO nonlinear equations: w = u(k, x) + a(h, y) + n(σ), where k indicates the Volterra kernels, σ is a noise term, and H is a feedback term. The MIMO model is constructed of parallel MISO computations expanded with corresponding definitions. Near Right: MIMO predicted CA1 output for Left and Right Sample derived via MIMO model from the CA3 firing input at left. Far Right: Actual CA1 firing corresponding to the MIMO model output. Neuron firing rates spike probability indicated by color scale.

