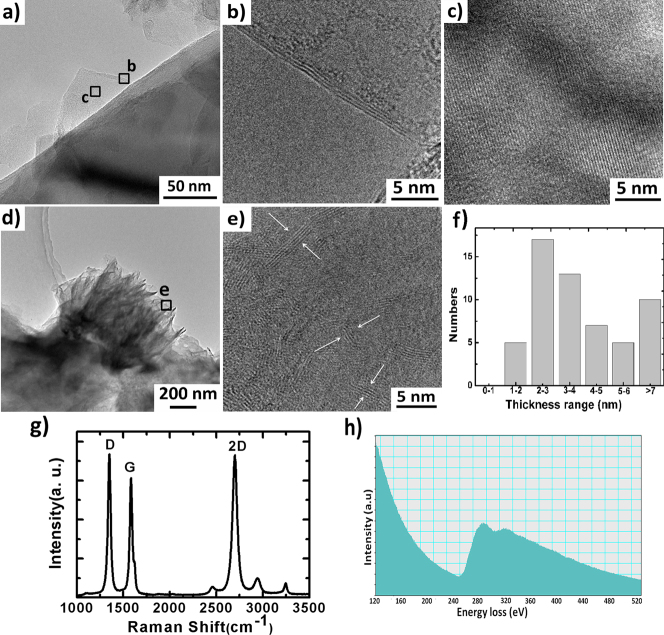
Figure 2.
(a) Low-magnification TEM image of single graphene growth vertically on the surface of silicon nanocone. (b), (c), HRTEM images of the areas marked b, c in panel (a). (d) Low-magnification TEM image of a perfect flowerlike GNSs. (e) HRTEM images of the areas marked e in panel (d). (f) Statistics of the thickness distribution of GNSs. (g) Raman spectroscopy of GNSs. (h) Typical EELS spectrum of the GNSs.

