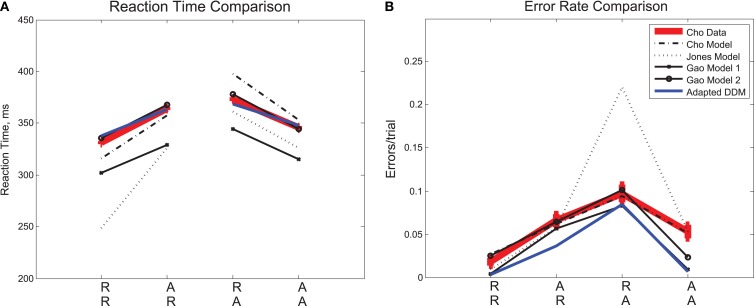
Figure 2.
Mean (A) RTs and (B) ERs for the data in Experiment 1 (Cho Data), the three published fits to the data (Cho, Jones, Gao), and the fit presented for this data in the adapted DDM of the present study. In the diagram, an RR sequence refers to the RT on the second repetition of a stimulus (e.g., left, left, left) and an AR sequence refers to the RT on the first repetition of a stimulus (e.g., left, right, right), etc. The adapted DDM provides the best fit to RTs, but underestimates errors, especially for AA sequences.

