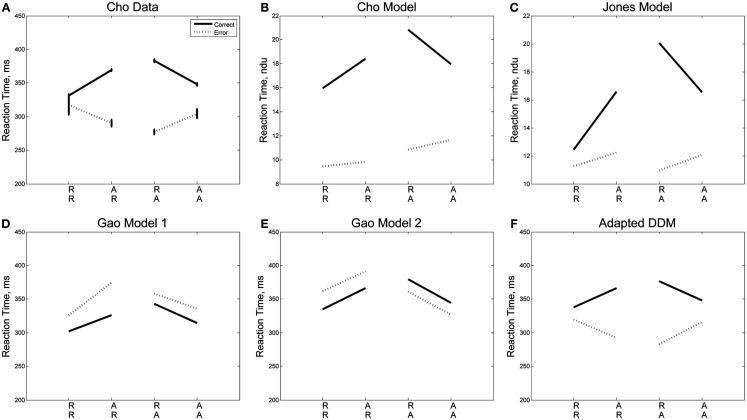
Figure 3.
Sequential effects in Experiment 1: (A) data, (B) results of the Cho Model (Cho et al., 2002), (C) results of the Jones Model (Jones et al., 2002), (D,E) results of the Gao Models (Gao et al., 2009), and (F) results of the adapted DDM. The Cho and Jones models predict a dimensionless reaction time, which we give here in non-dimensional units (B,C). The adapted DDM captures the slopes of the R and A curves for error and correct trials. In these figures, the correctness or lack thereof of a given trial corresponds only to that trial itself, so a left-right-left sequence is tabulated as correct for the final left stimulus if and only if the final trial were identified correctly as a left stimulus.

