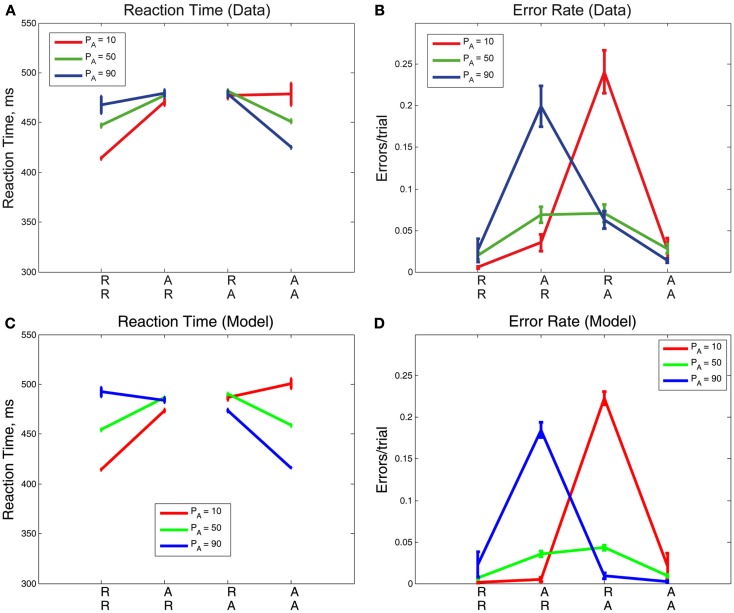
Figure 6.
Mean (A) RTs and (B) ERs for the three values of PA in Experiment 2, averaged over correct and error trials. The influence of PA is most apparent in the mean RT plot on expected trials (RR, AA) and in the mean ER on unexpected trials (AR, RA). Model fits for (C) RTs and (D) ERs re-create behavioral trends in RTs and ERs but overestimate RTs for expected trials (RR, AA). The error bars in plots (A,B) represent the standard error of the mean, and in (C,D) the average value of standard error of the mean over 10 simulation runs (see Section 2.4 for details).

