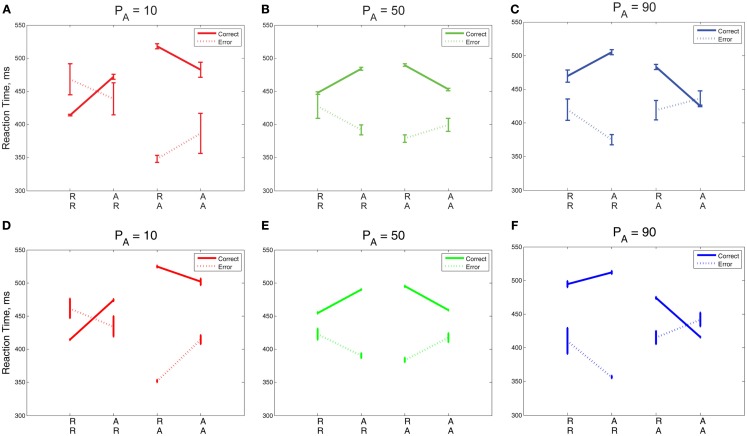
Figure 7.
(A–C) RT data for error and correct trials in Experiment 2 compared with the adapted DDM (D–F). The slopes of the R and A lines are reversed for correct and incorrect responses. Error trials incur faster responses on unexpected trials (RA, AR) than on expected trials (RR, AA); this trend is reversed for correct responses. For low PA, the R lines overlap, and for high PA, the A lines overlap, resulting in an approximate reflectional symmetry between data for the high and low PA blocks, so that sometimes the mean time for an error trial is slower than for a correct trial. The error bars in plots (A–C) represent the standard error of the mean, and in (D–F) the average value of standard error of the mean over 10 simulation runs (see Section 2.4 for details).

