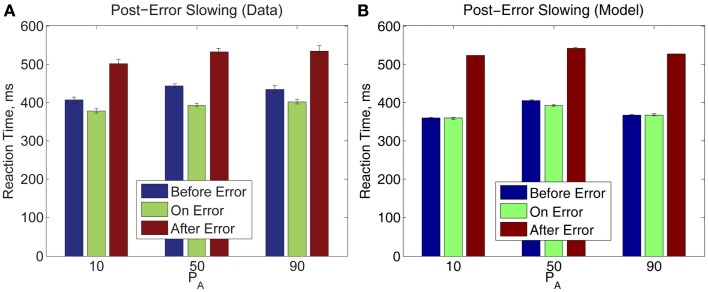
Figure 9.
(A) Post-error slowing in Experiment 2 data is independent of PA. (B) The model fit also predicts post-error slowing but does not fully account for pre-error speeding. The error bars in plot (A) represent the standard error of the mean, and in (B) the average value of standard error of the mean over 10 simulation runs (see Section 2.4 for details).

