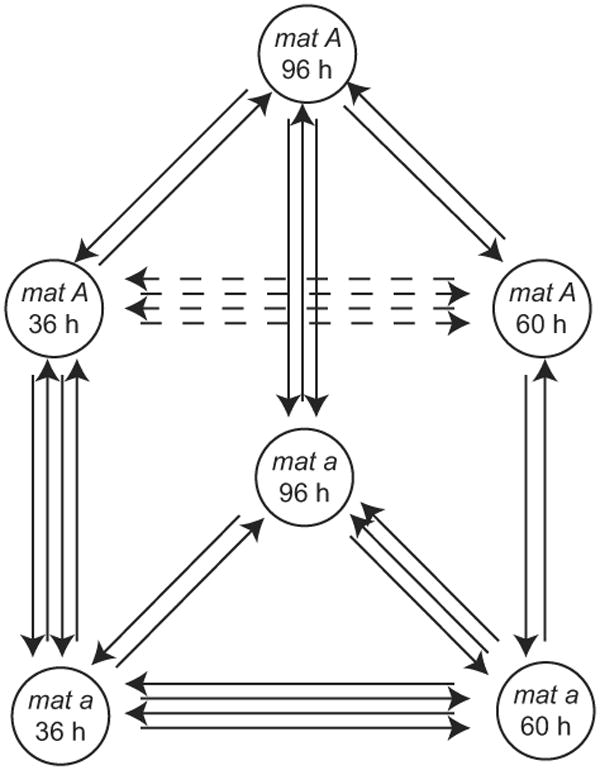
Figure 1.

Experimental design for microarray comparisons of sex-specific gene expression during asexual development of Neurospora crassa. Each arrow represents an independent reverse transcription and microarray hybridization from numerous pooled biological replicates. Each arrowhead corresponds to the sample labeled with cyanine 5-dUTP, and each blunt end corresponds to the sample labeled with cyanine 3-dUTP. All samples were compared directly to neighboring time points, and the circuit design was closed by direct comparisons of 36 h to 96 h samples. Additionally, all time points featured direct comparisons between samples from strains of opposite mating type.
