Figure 3.

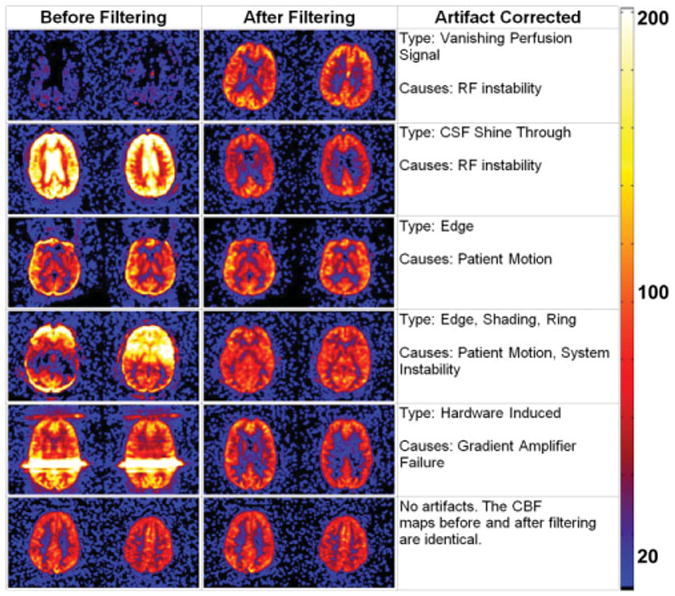
Examples of clinical CBF maps before and after ASL filtering for both unstable and stable cases. The scale for the color map is in milliliters of blood / 100 g of tissue / minute.

Examples of clinical CBF maps before and after ASL filtering for both unstable and stable cases. The scale for the color map is in milliliters of blood / 100 g of tissue / minute.