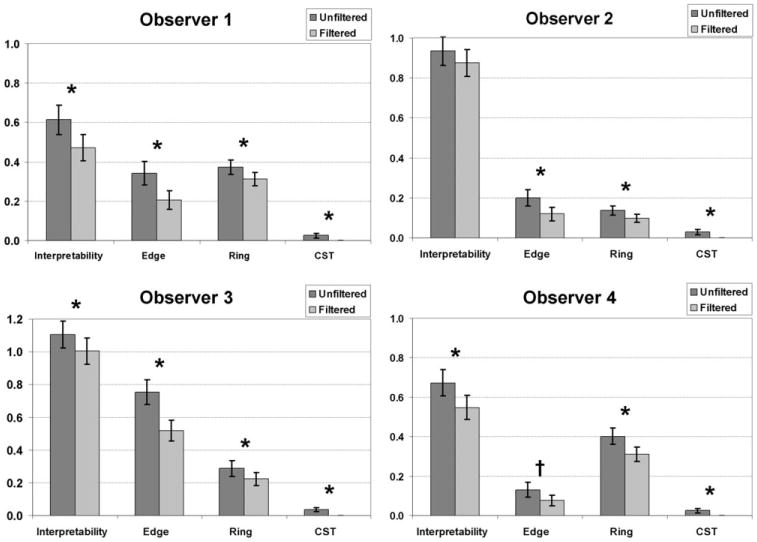
Figure 4.

Bar charts showing image quality scores based on each of the four categories, interpretability, edge artifact, ring artifact, and CSF shine-through artifact, for all observers. *The rating score is significant that the filtered CBF map is better than the unfiltered CBF map. †The rating score indicates there is a trend that the filtered CBF map is better than the unfiltered CBF map.
