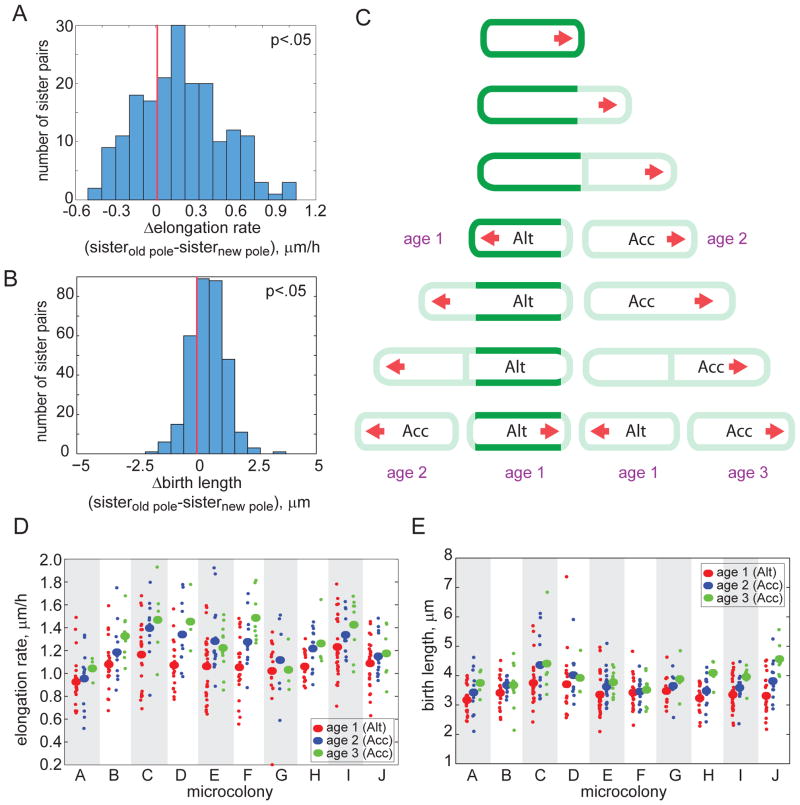
Figure 3. Division creates sister cells with different growth properties.
(A–B) Distribution of the differences in elongation rate (A) and birth length (B) between sister cells inheriting the old pole and the new pole. The distributions are skewed (p<0.05; red lines denote zero), indicating that the sister inheriting the older pole elongates faster (in 71% of the 161 sister pairs) and is larger at division (in 74% of the 161 sister pairs). In 7.5% of the 161 sister pairs, the sister that inherited the new pole elongated faster and was longer at birth than its sister. (C) Schematic model for mycobacterial growth. A labeled cell (green) is shown to elongate from one pole (red arrow). Two sister cells are created at division: an accelerator (Acc) cell inheriting the old (growing) pole and an alternator (Alt) cell inheriting the new pole. Growth pole age (in generations) is labeled in purple. (D–E) Elongation rate (D) and birth lengths (E) are plotted for ten microcolonies, with cell subpopulations grouped by growth pole age. Growth pole age was scored by mapping the pedigrees of unlabeled cells through several generations via live cell imaging. Subpopulation means (large ovals) are plotted along with data from individual cells (small circles). Elongation rate and birth length increase within a colony as the growth poles age (p<0.05 for alternator vs. accelerator elongation rates; and p<0.05 for alternator vs. accelerator and age two vs. age three birth lengths).

