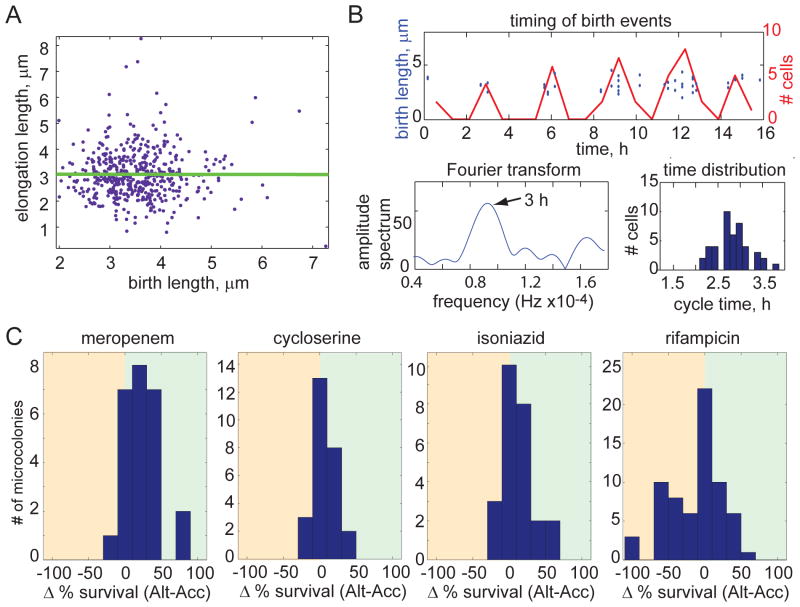
Figure 4. Population heterogeneity of growth characteristics is maintained by time-based cell division cycle regulation and contributes to differential susceptibility to antibiotic stress.
(A) Birth length and elongation length, which is defined as the length that the cell elongates between birth and division, are uncorrelated for 322 M. smegmatis cells (regression slope of 0.00), suggesting that mycobacteria use time to regulate their cell cycle. (B) Cell cycle timing is characterized for one microcolony (a second representative microcolony is shown in fig. S3B). Division events are plotted in the time domain as discrete events (blue circles; left axis) and as a histogram (red line; right axis). The histogram of birth events was used to generate an amplitude spectrum with a Fourier transform, shown in the lower left plot. The peak represents the cycle time of the microcolony (arrow). The spread of cycle times for individual cells is shown here as histogram in the lower right. (C) Distributions of the difference in bacterial survival between accelerator and alternator cells for each microcolony following treatment with meropenem, cycloserine, isoniazid, and rifampicin at minimal inhibitory concentrations (2.3 mM, 0.04 mg/ml, 25 μM, and 50 μM, respectively; p<0.05 for each distribution). Survival was scored by determining the percentage of cells that were able to regrow after antibiotic was removed. The analysis includes 317 cells in 25 microcolonies for meropenem, 374 cells in 26 microcolonies for cycloserine, 334 cells in 25 microcolonies for isoniazid, and 453 cells in 66 microcolonies for rifampicin.

