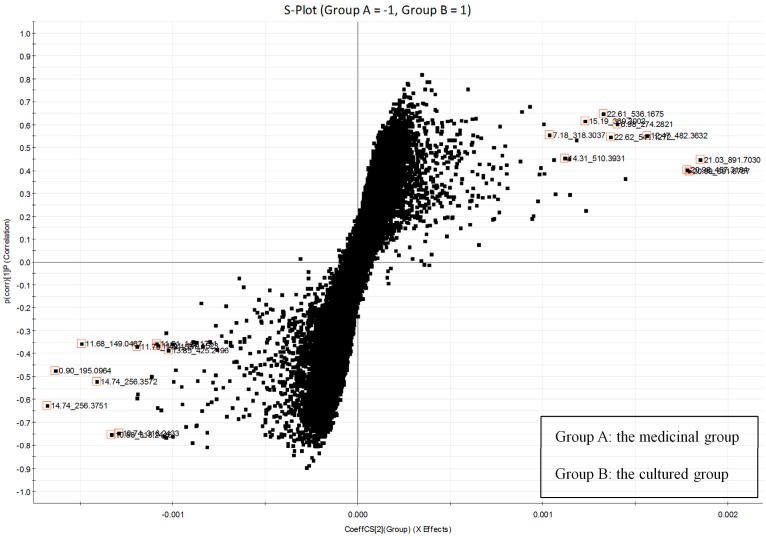
Figure 3.
Orthogonal projection to latent structures discriminant analysis (OPLS-DA) S-plot of oyster shell samples in positive ion mode (group A: the medicinal group; group B: the cultured group). Each point represents an individual extracted mass-retention time pair (EMRT). The Y-axis denotes confidence of a marker’s contribution to the group differences, and the X-axis denotes the contribution of a particular marker to the group differences. The top 20 VIP variables were marked in the S-plots.

